Convergence: Environmental dimension
To measure environmental convergence, Eurofound monitors the following indicators: greenhouse gas emissions; municipal recycling rate; share of population unable to adequately heat homes
The current page is not translated to the selected language.
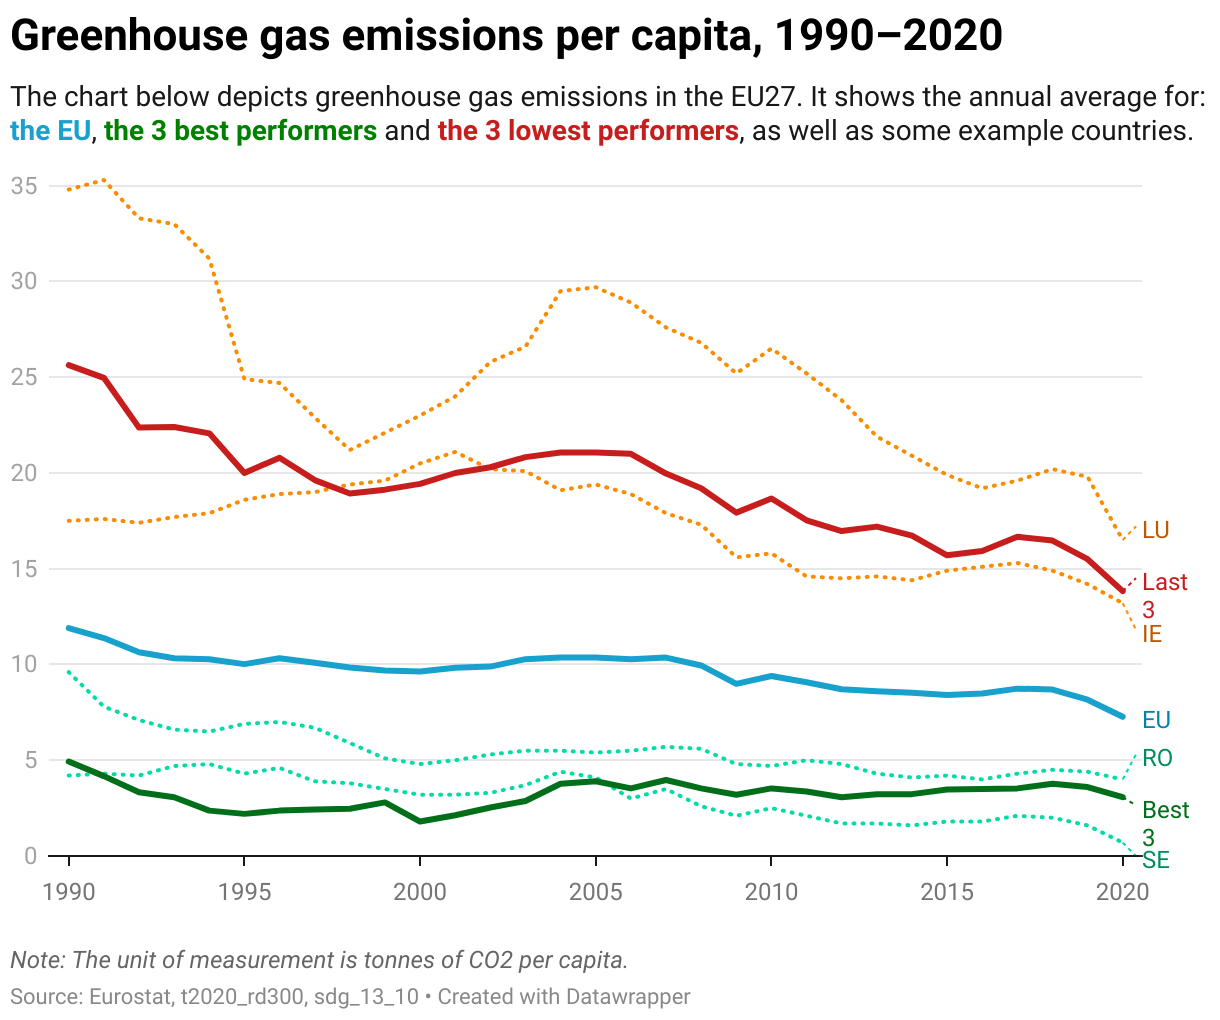
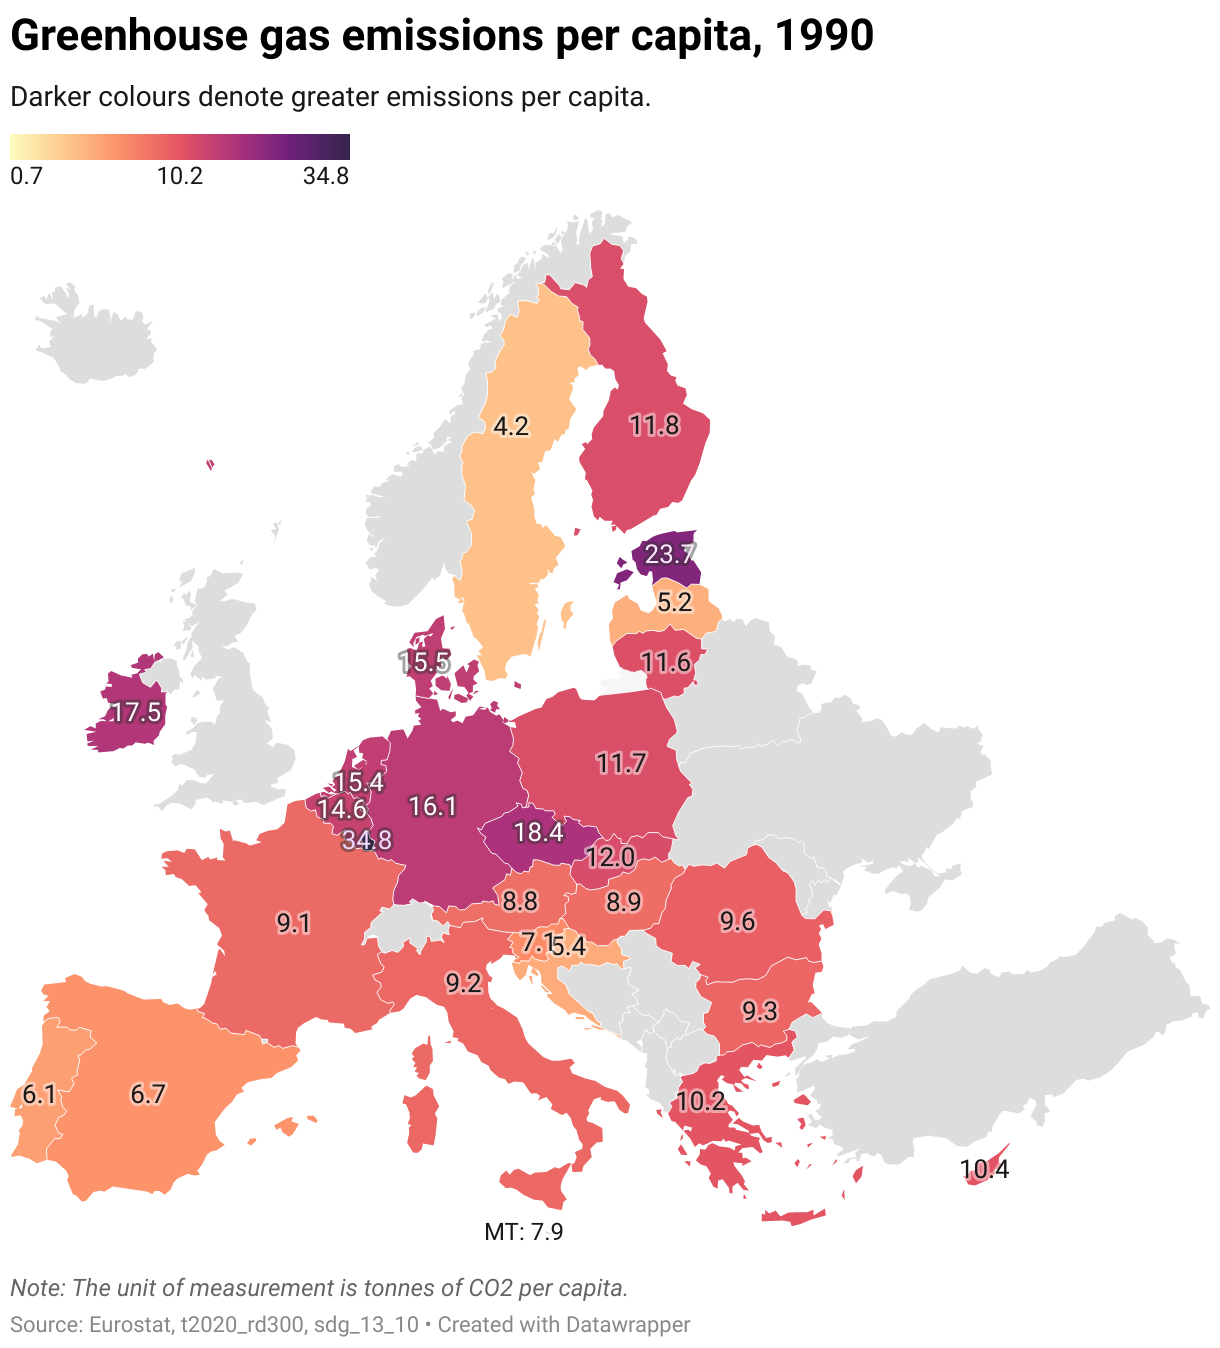
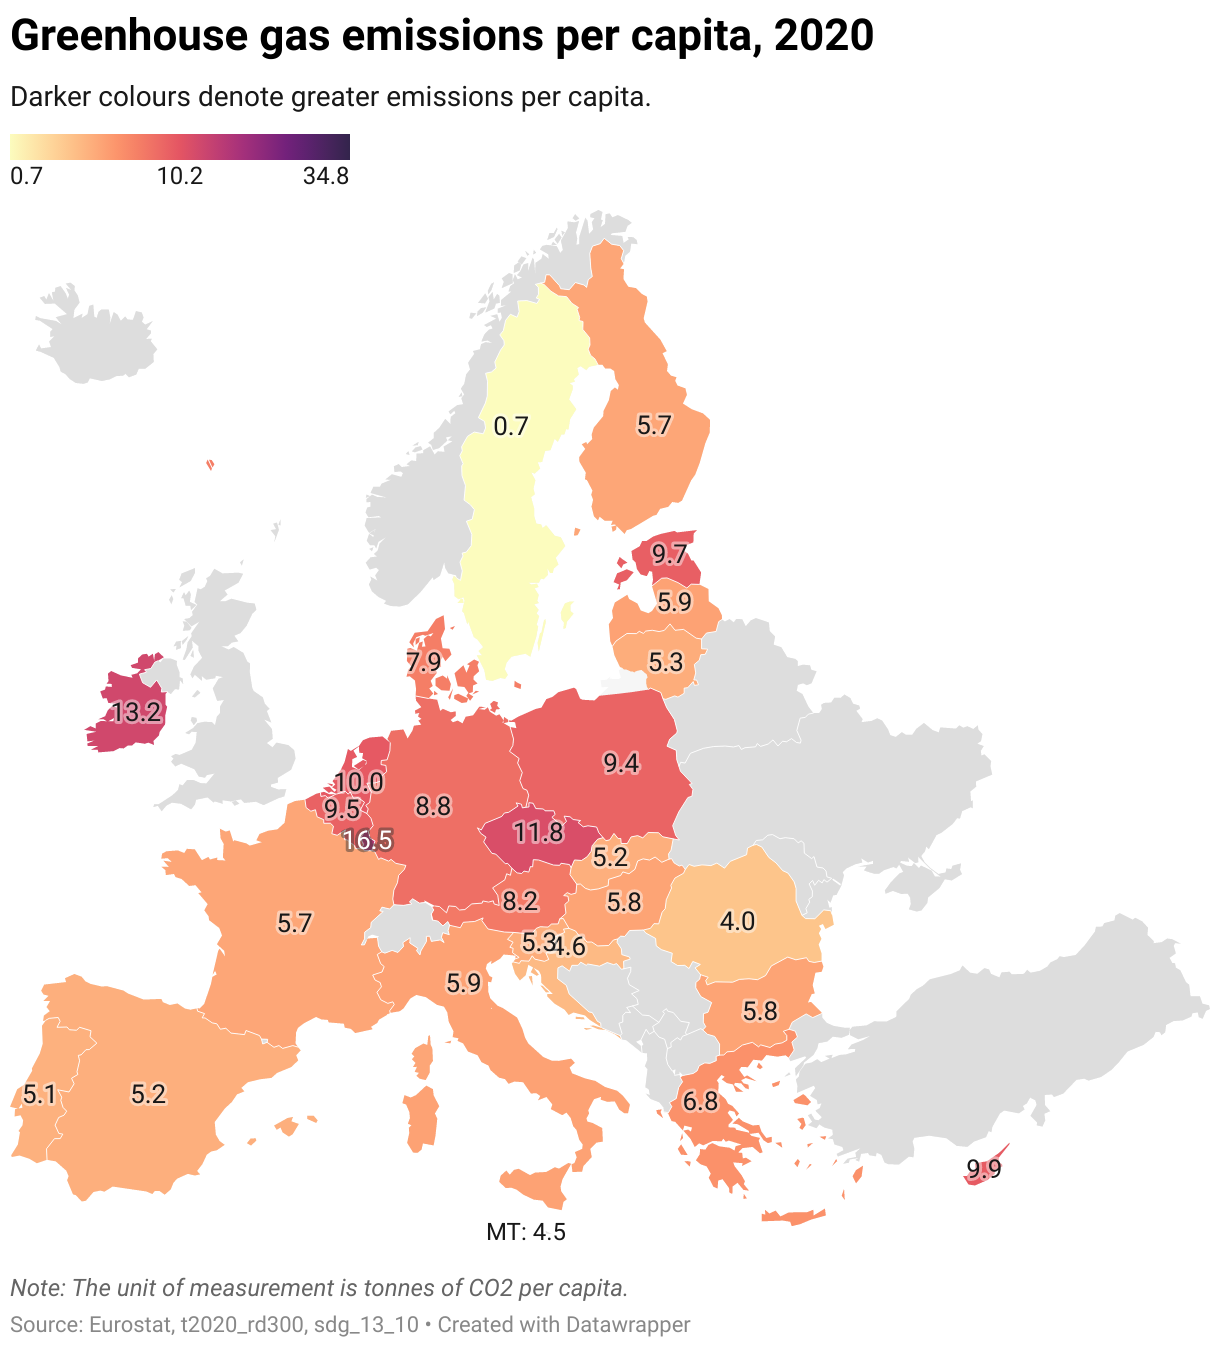
For the period 1990–2019, there was upward sigma convergence, delta convergence and beta convergence for the rate of greenhouse gas emissions per capita in the EU Member States.
The unweighted EU average and the standard deviation decreased overall (upward sigma convergence); however, there was a prolonged period from 2000 to 2007 when both decreased (downward sigma divergence). Statistically significant beta convergence was recorded, indicating a catching-up process among Member States where those lagging behind improved their performance faster than top-performing countries.
For the entire period of analysis, Luxembourg had the highest rates of greenhouse gas emissions per capita. The best performers were Sweden, Latvia and Croatia.
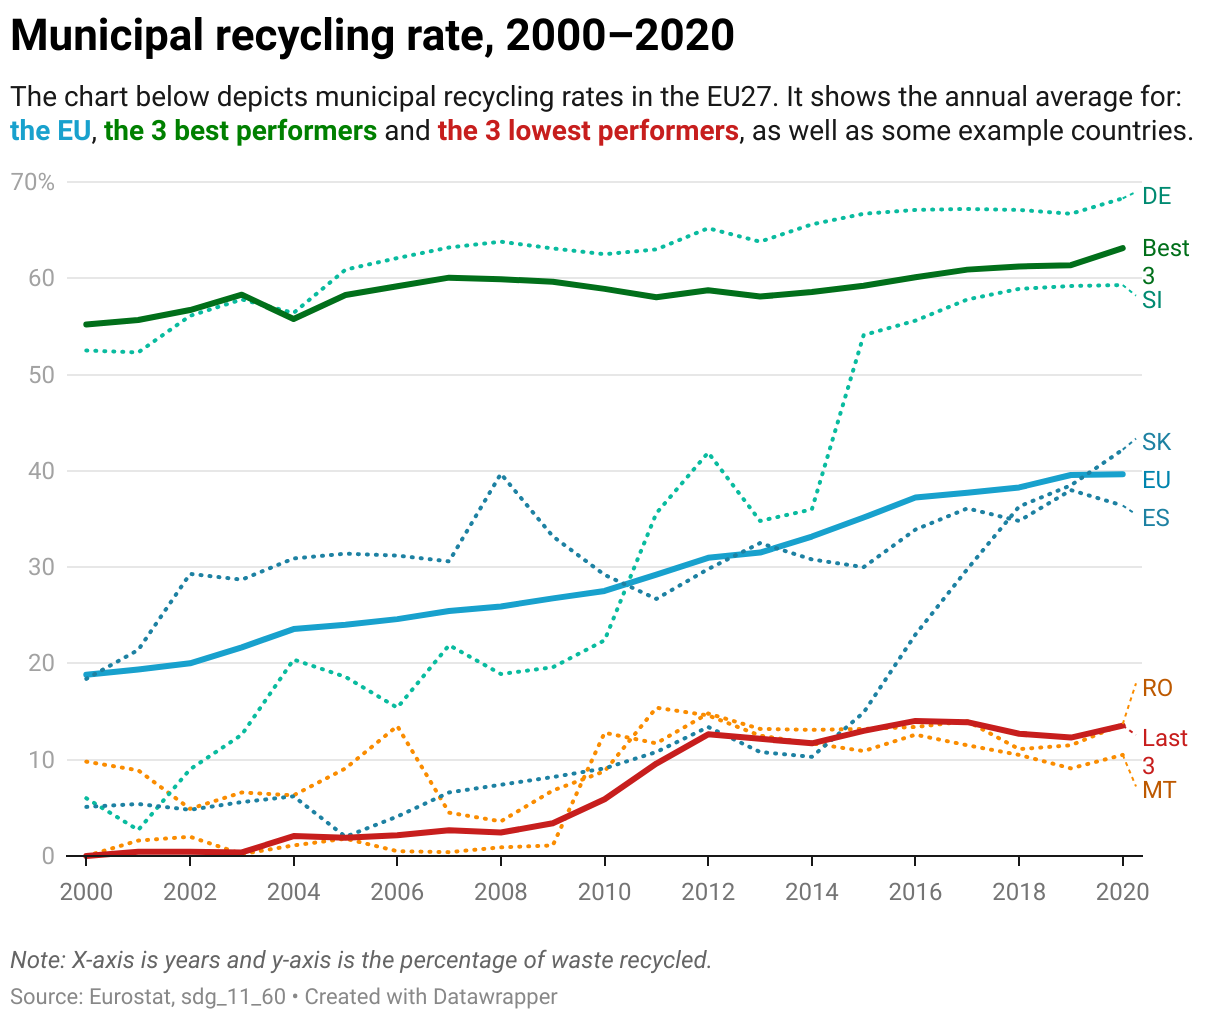
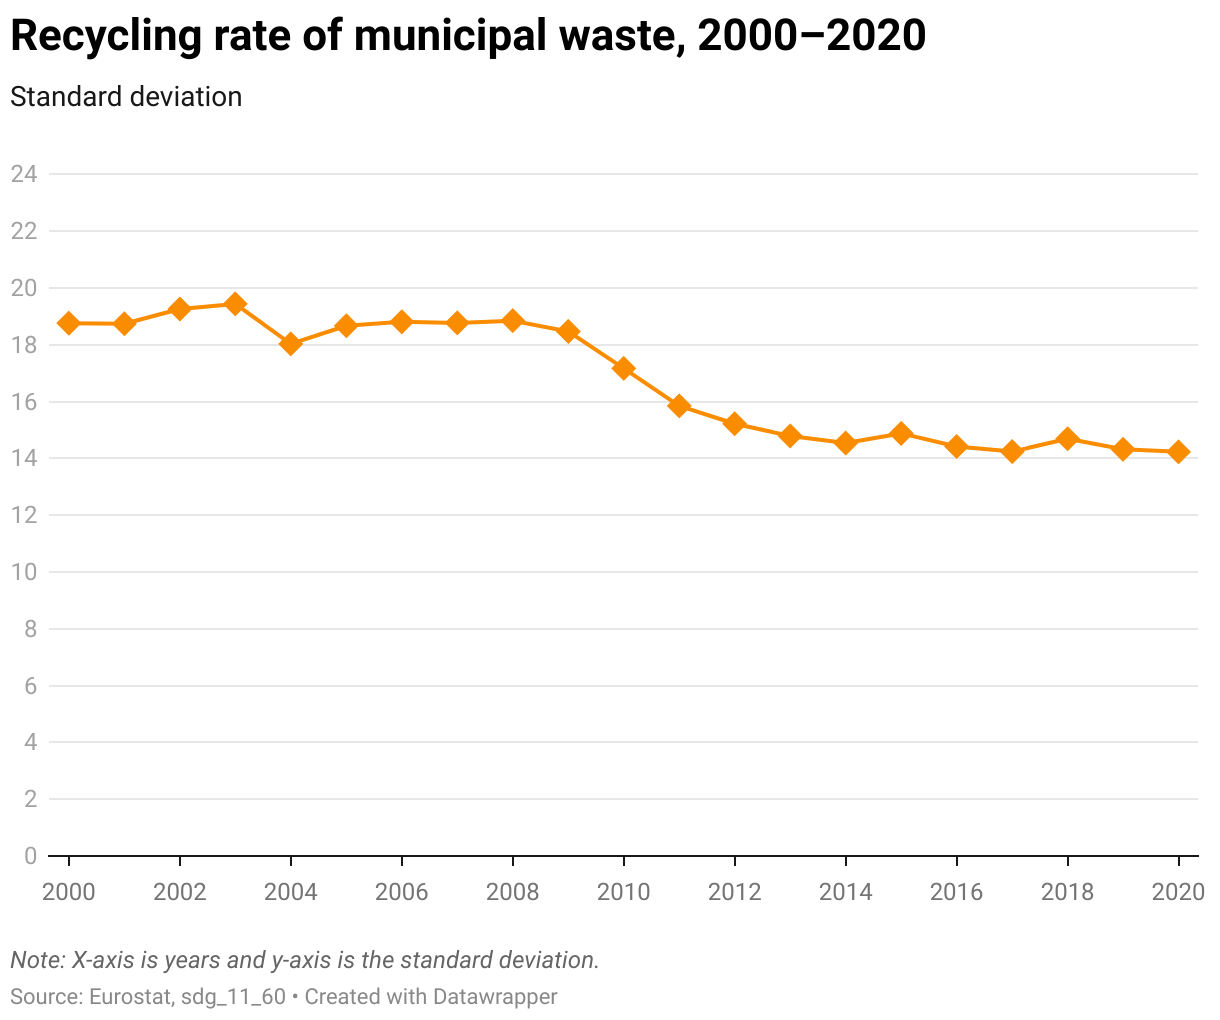
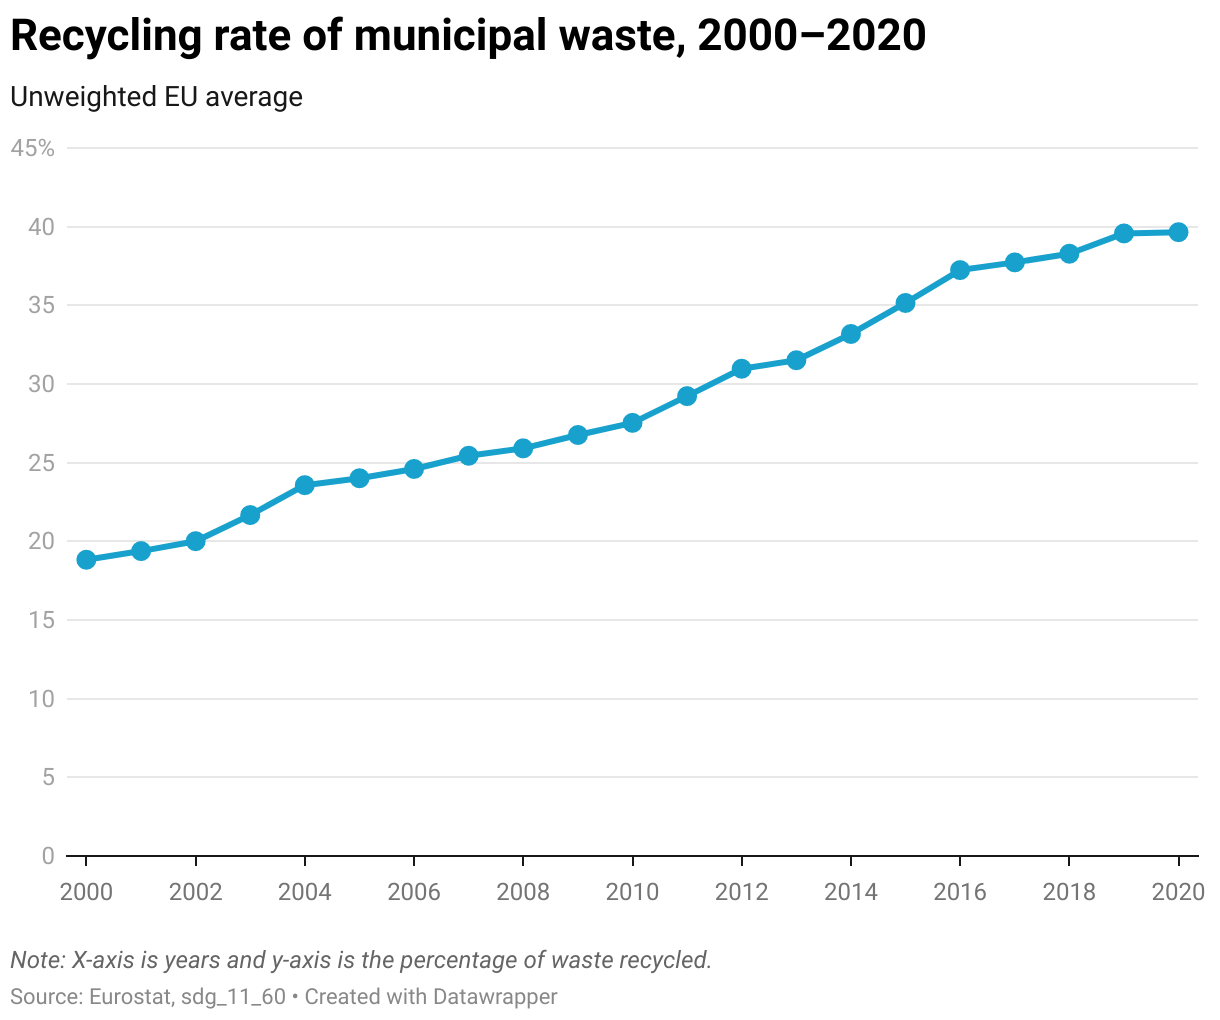
Upward sigma convergence, beta convergence and delta convergence were evident between EU Member States for the period 2008–2020 in the recycling rate of municipal waste. This refers to the tonnage recycled from municipal waste divided by the total municipal waste arising.
As the unweighted EU average increased and the standard deviation decreased, there was upward sigma convergence. The beta coefficient was negative and significant; there was a catching-up process within the EU27. Throughout the entire period, Germany remained the best performer, gradually increasing the gap between itself and second-best Member States. However, there was steady delta convergence, meaning that the sum of differences between Germany and the other countries kept shrinking.
There is a geographical divide, with Eastern European and Baltic states typically doing worse than their western counterparts. The best-performing nations were Germany, Austria, Belgium and the Netherlands. Slovenia and Slovakia both improved rapidly over the analysed time frame. The worst performers were Romania, Malta, Cyprus and Greece.
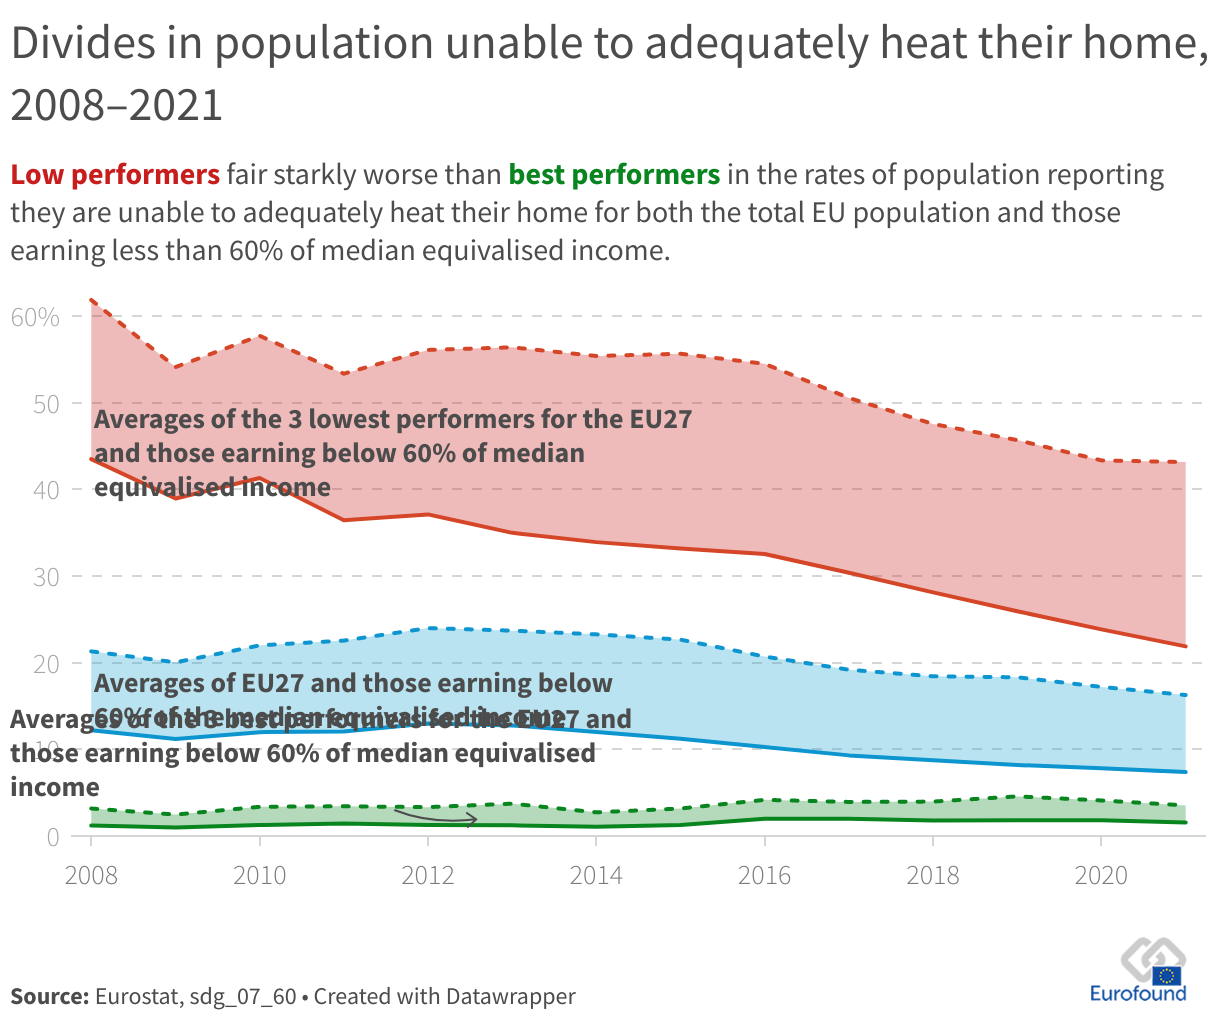
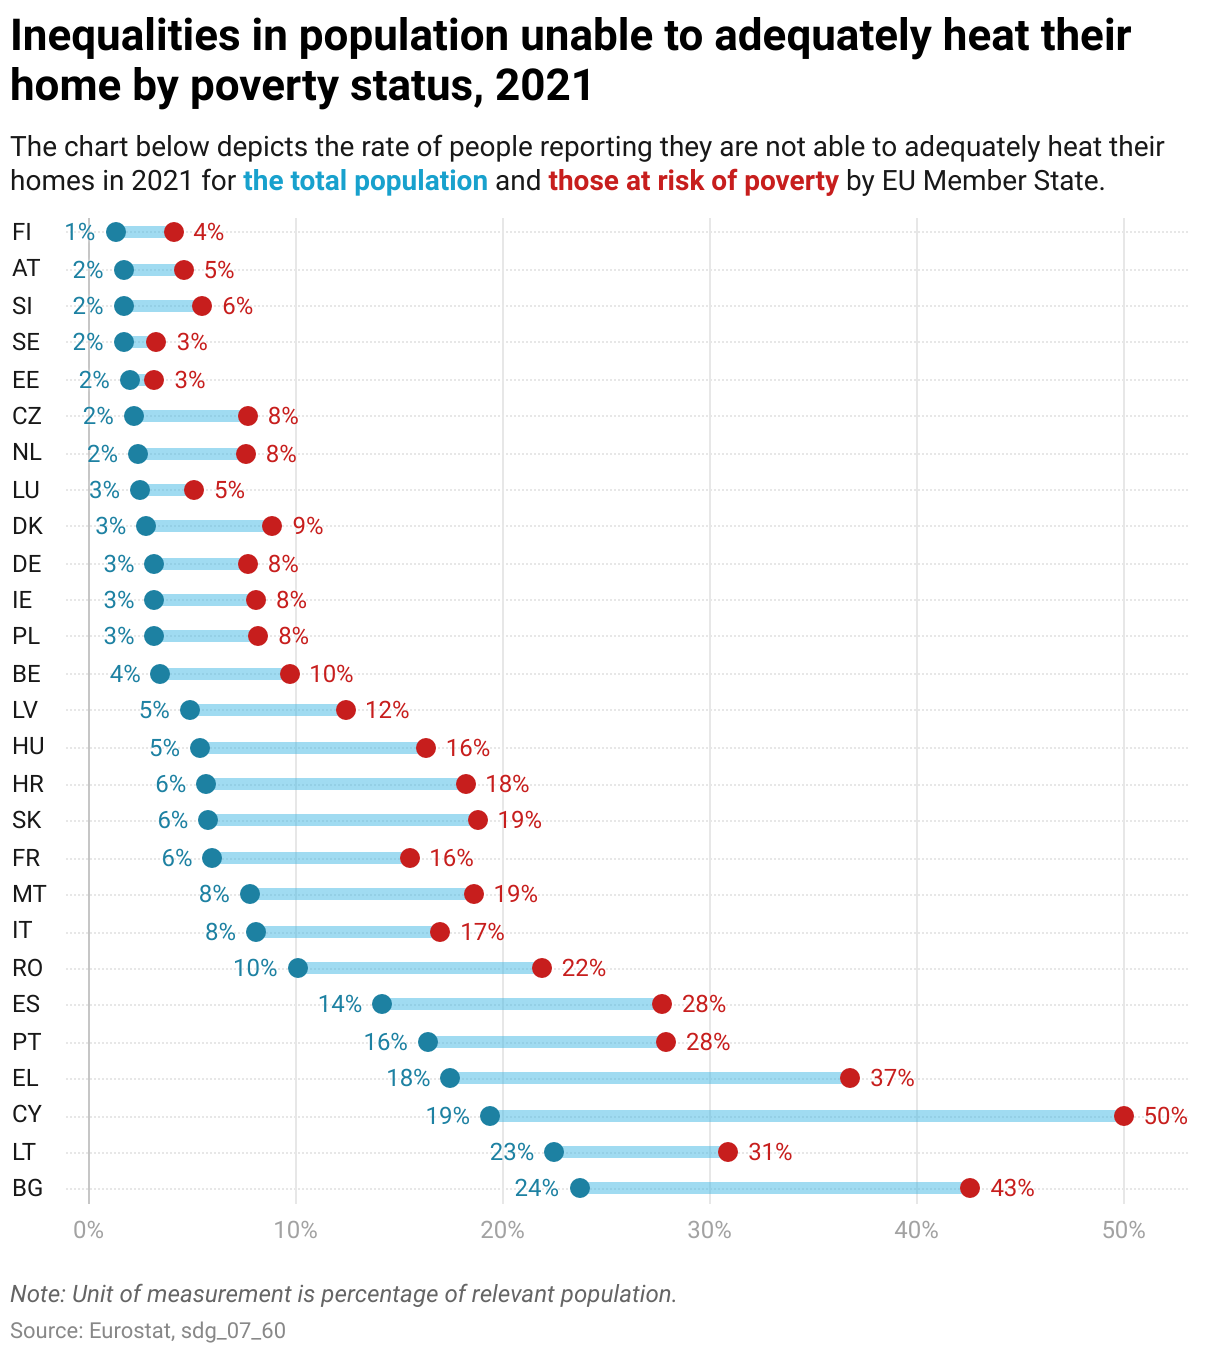
This indicator is a measure of energy poverty and is strongly linked to the social and economic dimensions. As such, it is unsurprising that it was affected by the 2008–2013 crisis. From 2004 to 2008 for both the total population and those with low income, there was upward sigma convergence, delta convergence and no statistically significant beta convergence in the share of the population unable to adequately heat their home. During the financial and ensuing economic crisis from 2008 to 2013, there was downward sigma convergence, delta divergence and no statistically significant beta convergence. Post-crisis there was upward sigma convergence, delta convergence and beta convergence. Interestingly, during the 2008–2013 crisis years when the unweighted EU average increased, disparities between Member States continued to decrease, meaning that countries became more alike.