Average marginal effects of sociodemographic and attitudinal predictors of support for environmental policies
Average marginal effects of sociodemographic and attitudinal predictors of support for environmental policies
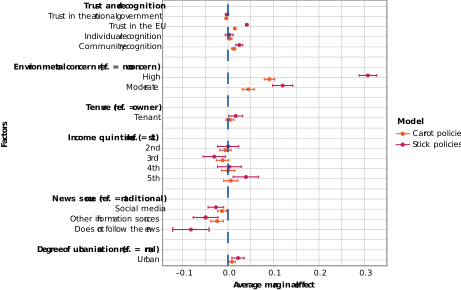
The coefficient of determination (R2) shows how well the dependent variables predict the independent ones. R2 for stick policies is 0.23, whereas for carrot policies it is 0.22. The graph represents the marginal effects and upper- and lower-bound confidence intervals of each variable in the estimation of a logit model in which the dependent variable is whether the respondent supports carrot or stick policies. The model also controls for subjective financial security, age, educational attainment, employment status and household type, as well as Member State-level fixed effects. Survey weights are applied. The first income quintile is the poorest 20 % of the population; the fifth income quintile is the wealthiest 20 % of the population. Table A5 in Annex 3 shows a breakdown of the modelling of support for stick and carrot policies.
Source: Authors’ estimates.