Data visualisation
New
Published: 19 November 2026Statistical analysis of the factors affecting propensity to make mobility changes
Data visualisation
Statistical analysis of the factors affecting propensity to make mobility changes
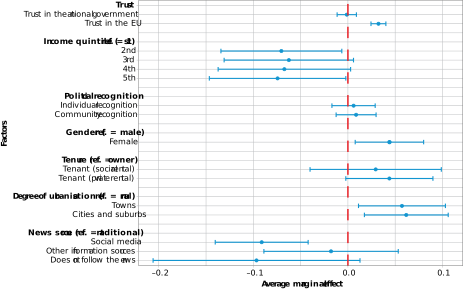
The graph represents the marginal effects, with 95 % confidence intervals, of factors used for the estimation of a probit model in which the dependent variable is whether the respondent has made any mobility changes to reduce their greenhouse gas emissions. The model also controls for subjective financial security, age, educational attainment, employment status and household type, as well as Member State-level fixed effects. The sample size is 17 734 observations. Survey weights are applied. The first quintile is the poorest quintile; the fifth quintile is the wealthiest quintile. The full regression results are presented in Table A7 in Annex 3.
Source: Authors’ estimates.