Statistical analysis of the probability of carrying out retrofits
Statistical analysis of the probability of carrying out retrofits
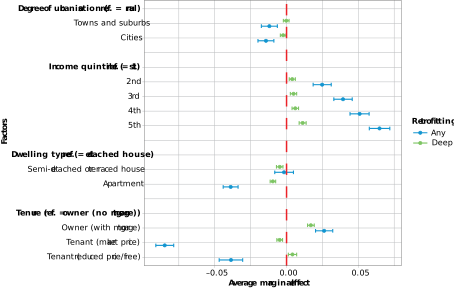
The graph represents the marginal effects, with 95 % confidence intervals, of factors used for the estimation of a probit model in which the dependent variable is whether the respondent has carried out any retrofits to their dwelling (blue symbols) or whether the respondent has carried out a deep retrofit to their dwelling (green symbols). The models also control for age, educational attainment, employment status, gender and household type, as well as Member State-level fixed effects. The sample size in both models is 346 029 observations. Survey weights are applied. The first quintile is the poorest quintile; the fifth quintile is the wealthiest quintile. The full regression results are presented in Table A8 in Annex 3.
Source: Authors’ estimates.