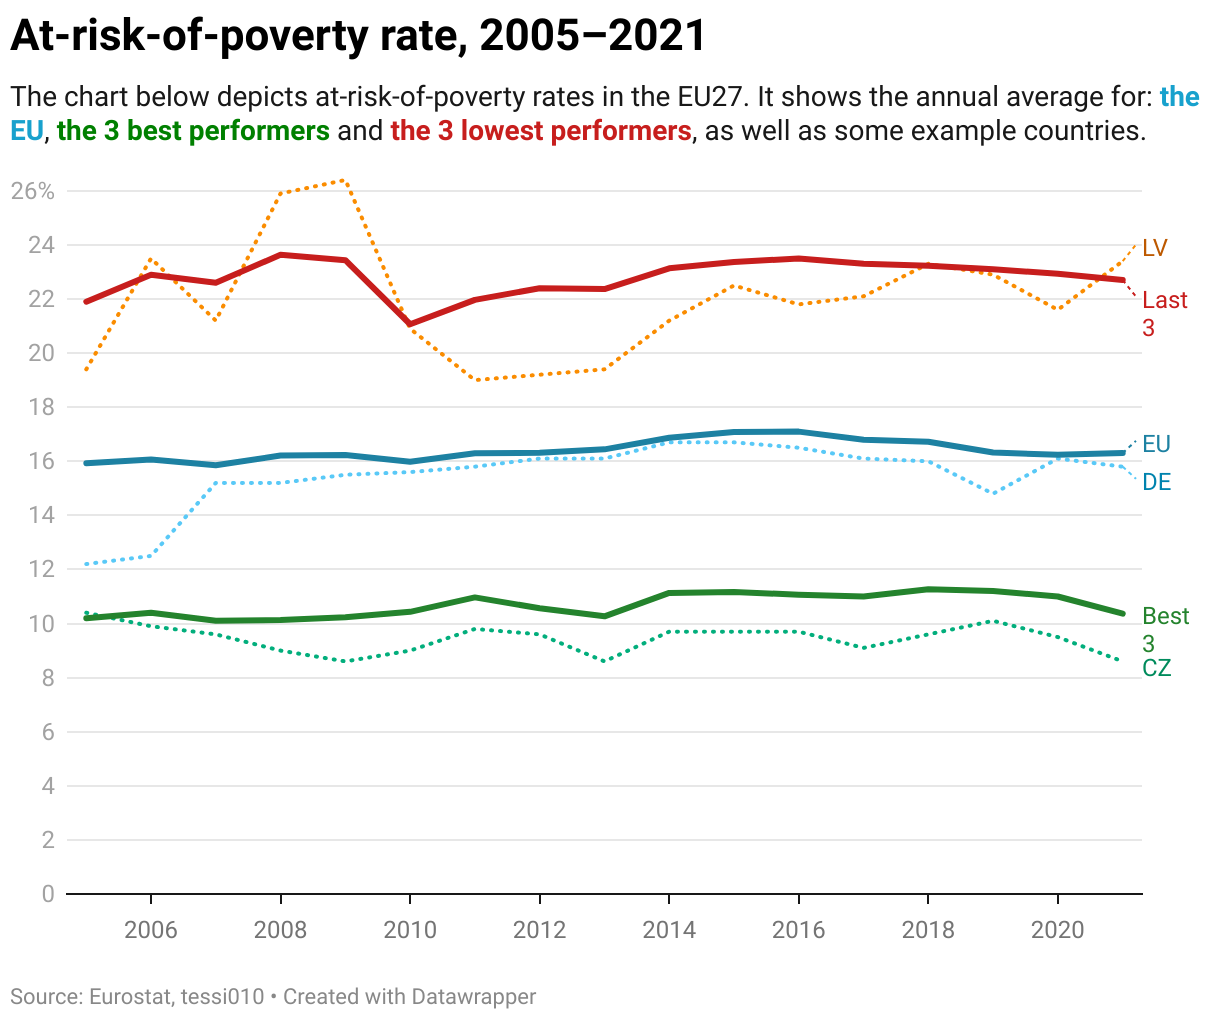
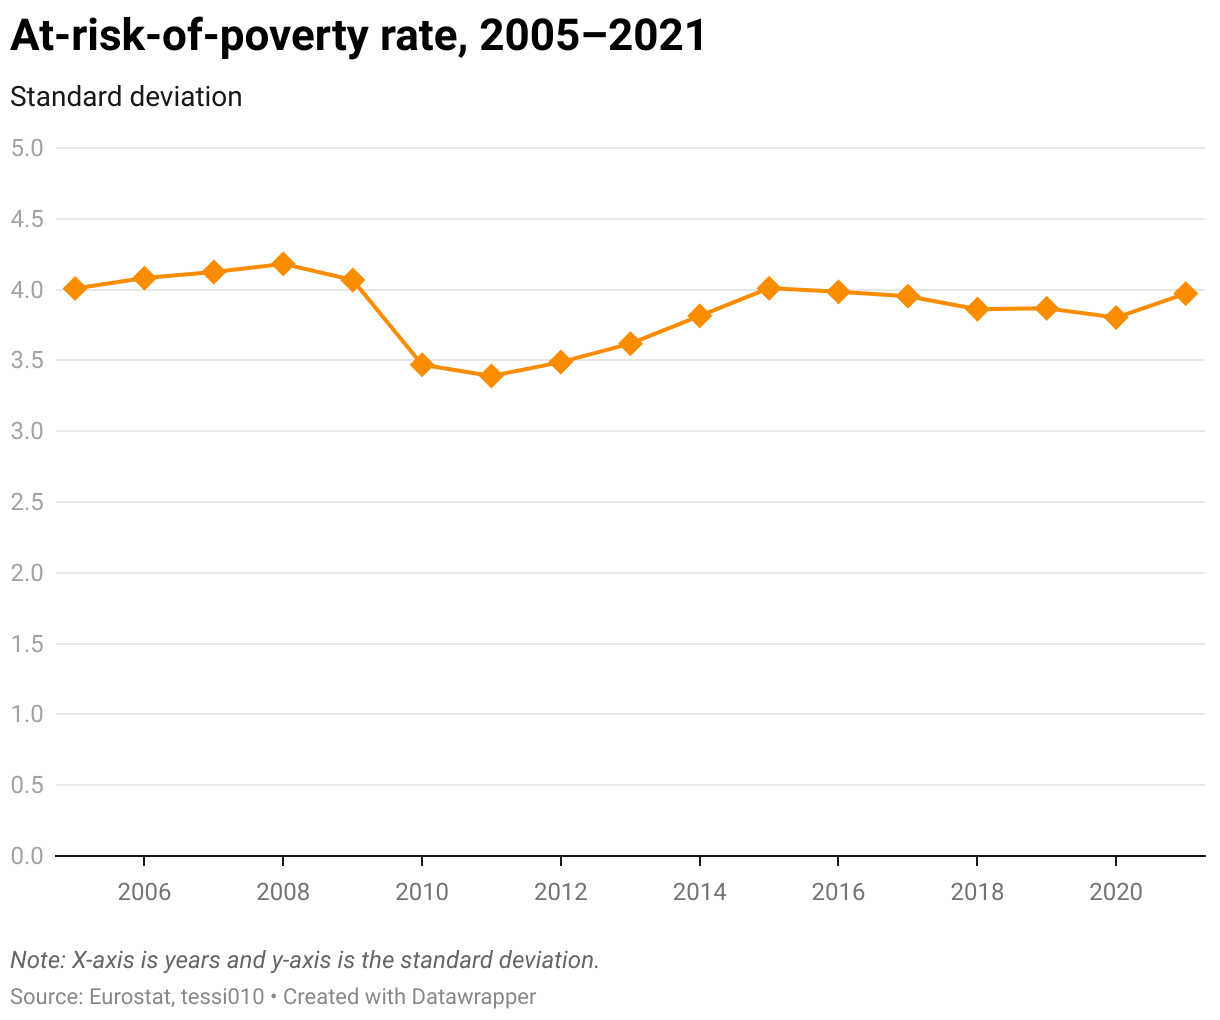
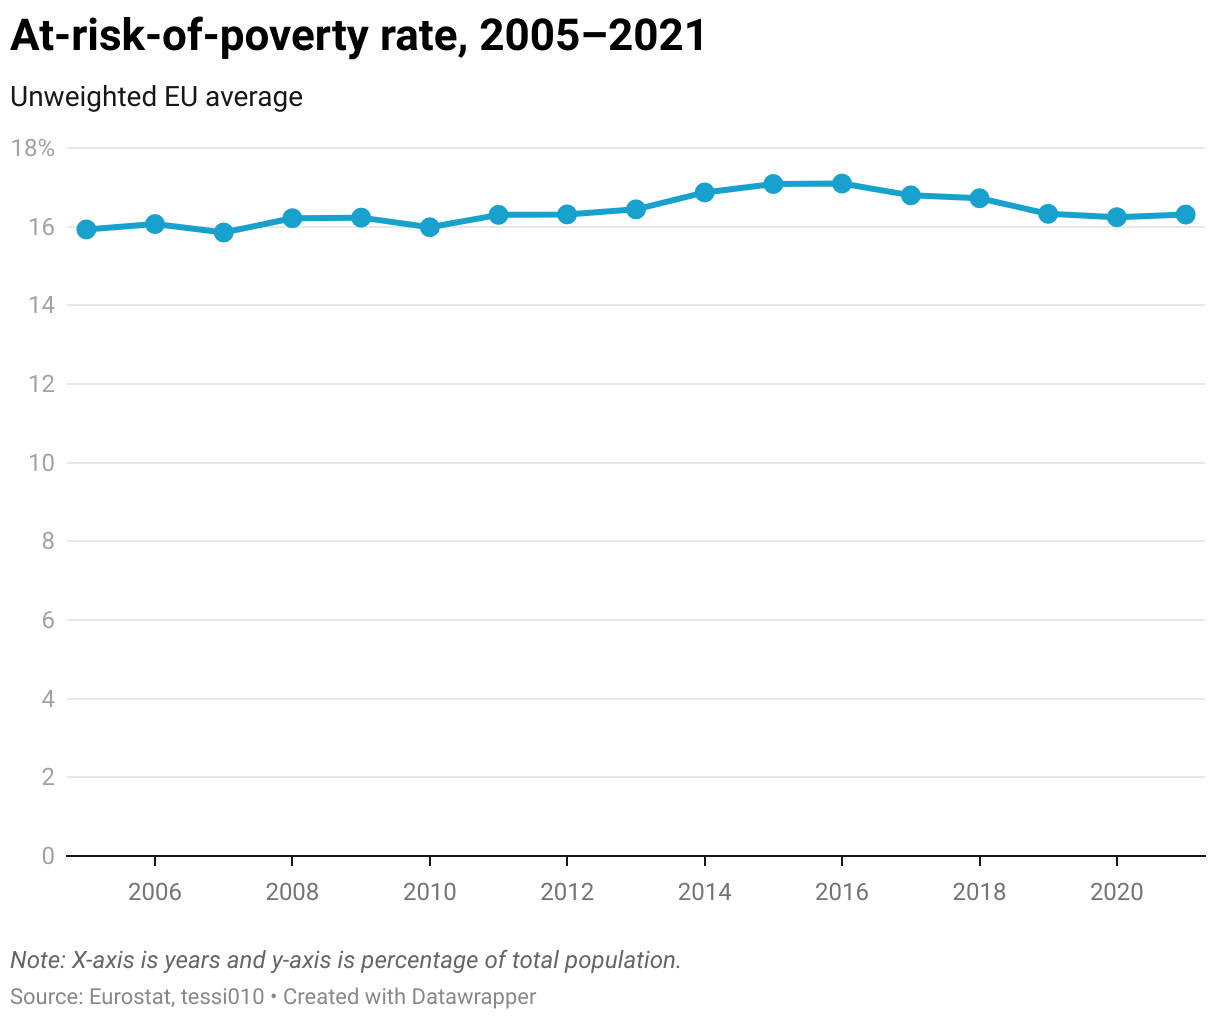
At-risk-of-poverty rate, 2005–2021
Overall, there was no significant catching-up process among the EU Member States in their at-risk-of-poverty (AROP) rate from 2005 to 2021. Additionally, the average AROP rate increased with a lagged effect in the years preceding the financial and economic crisis of 2008–2013. As the standard deviation from the EU mean decreased, there was overall downward sigma convergence. This means that in terms of the at-risk-of-poverty rate, Member States came to resemble each other more but also performed worse. Both disparities between countries and the EU average at-risk-of-poverty rate increased between 2020 and 2021, indicating that there is a risk of COVID-19 exacerbating inequalities.
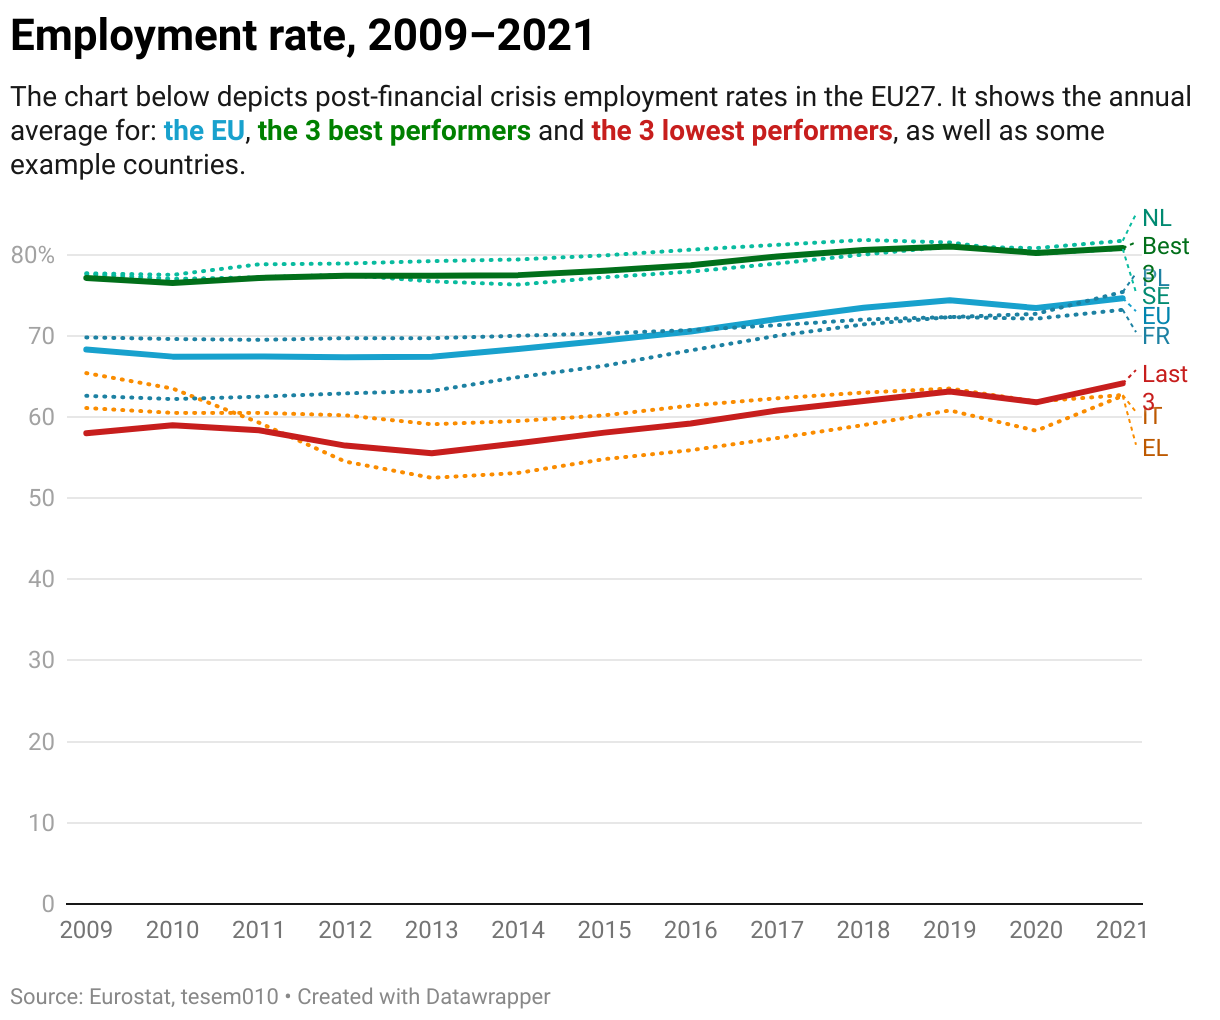
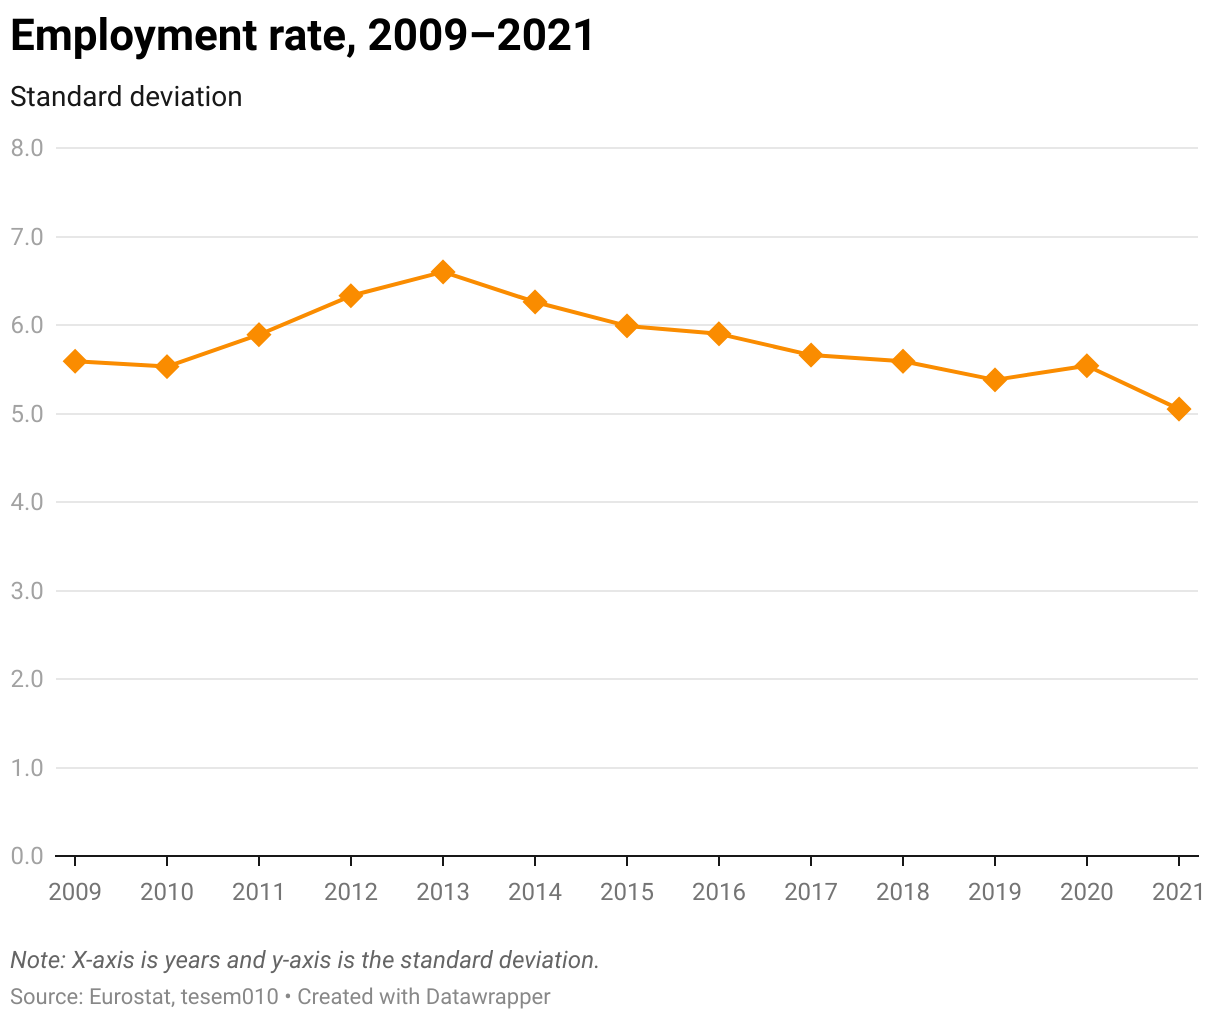
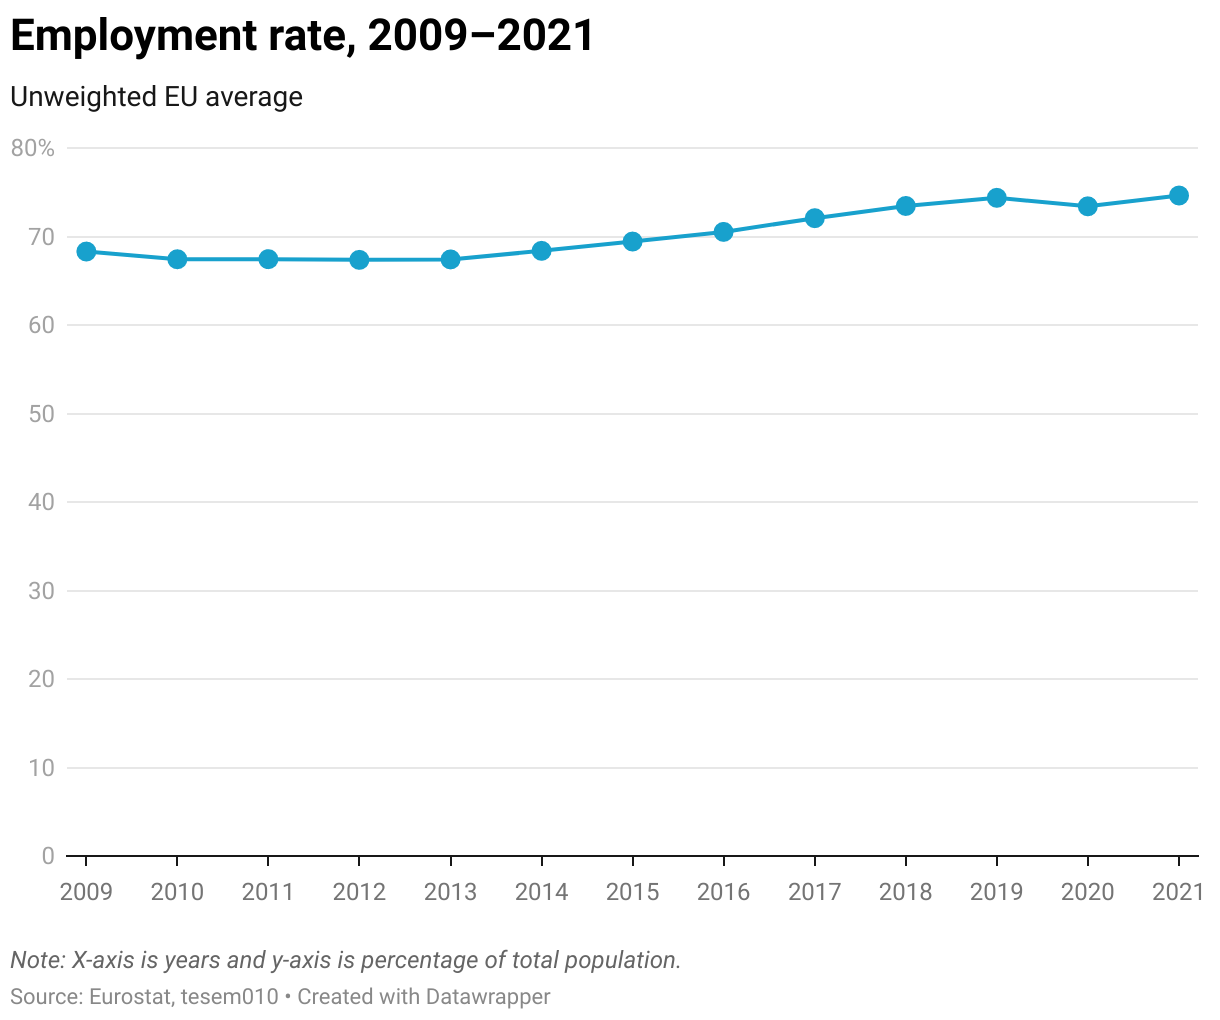
Employment rate, 2009–2021
The employment rate reacted negatively to the financial and economic crisis, with disparities between EU Member States increasing and the EU average decreasing. However, there has been a consolidation post-crisis: performance has improved across the board and disparities have decreased. Support measures put in place against the shocks caused by COVID-19 at Member State and EU level appear to have been successful, as in recent years disparities have further decreased and employment rates have not uniformly dropped.
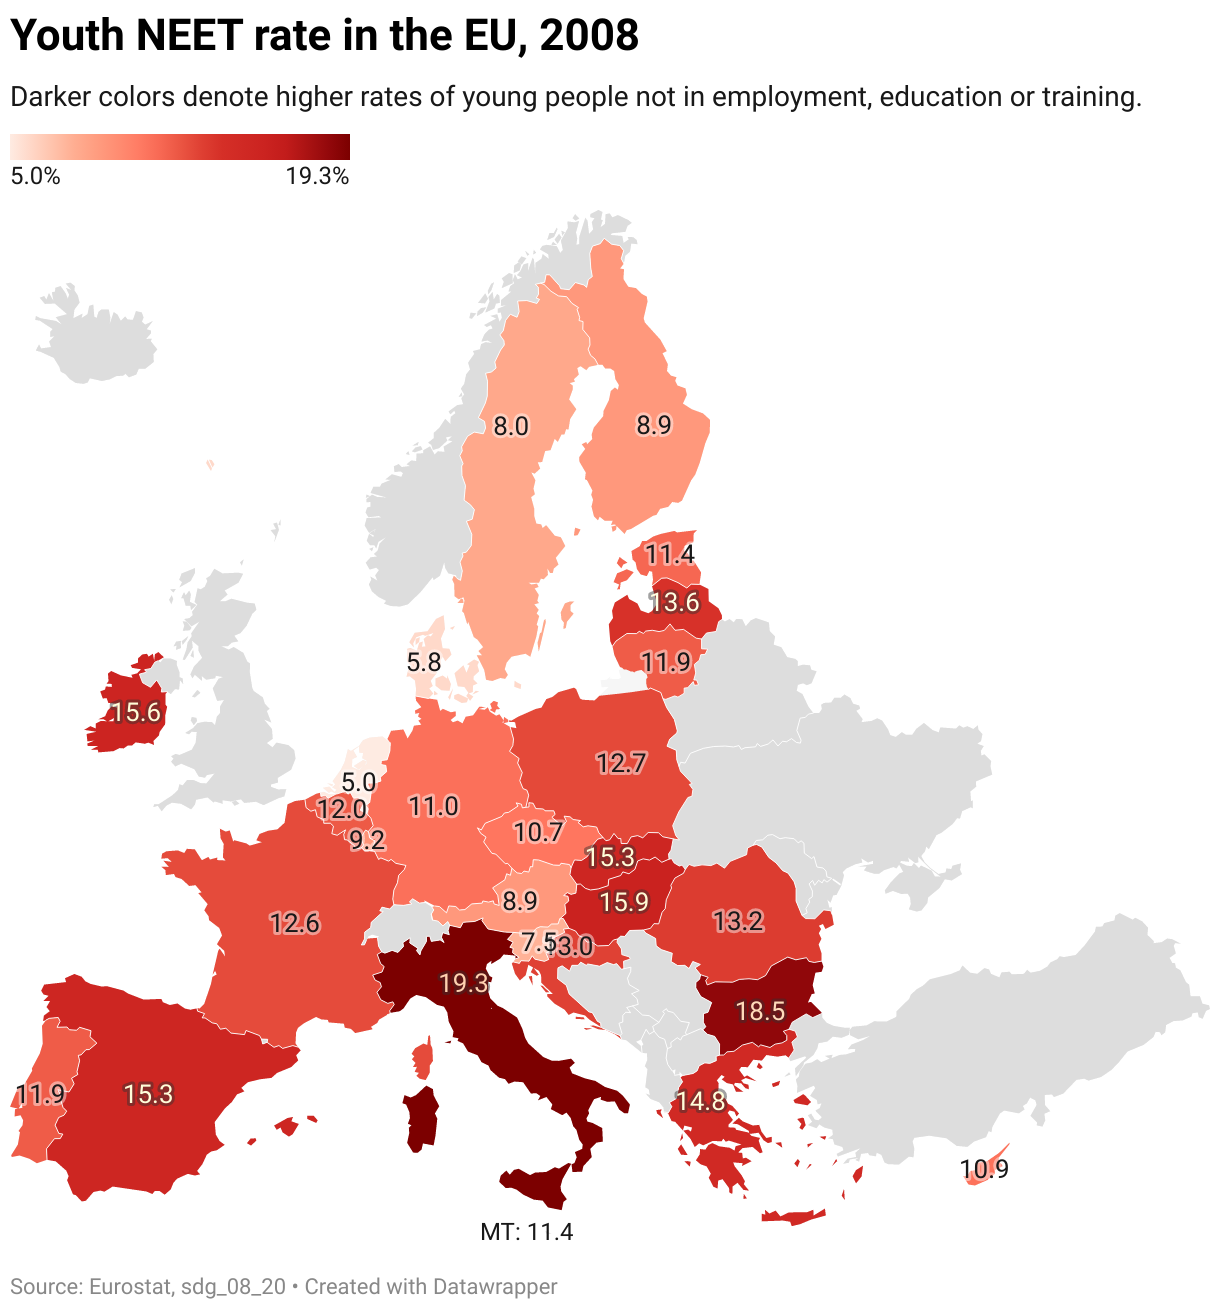
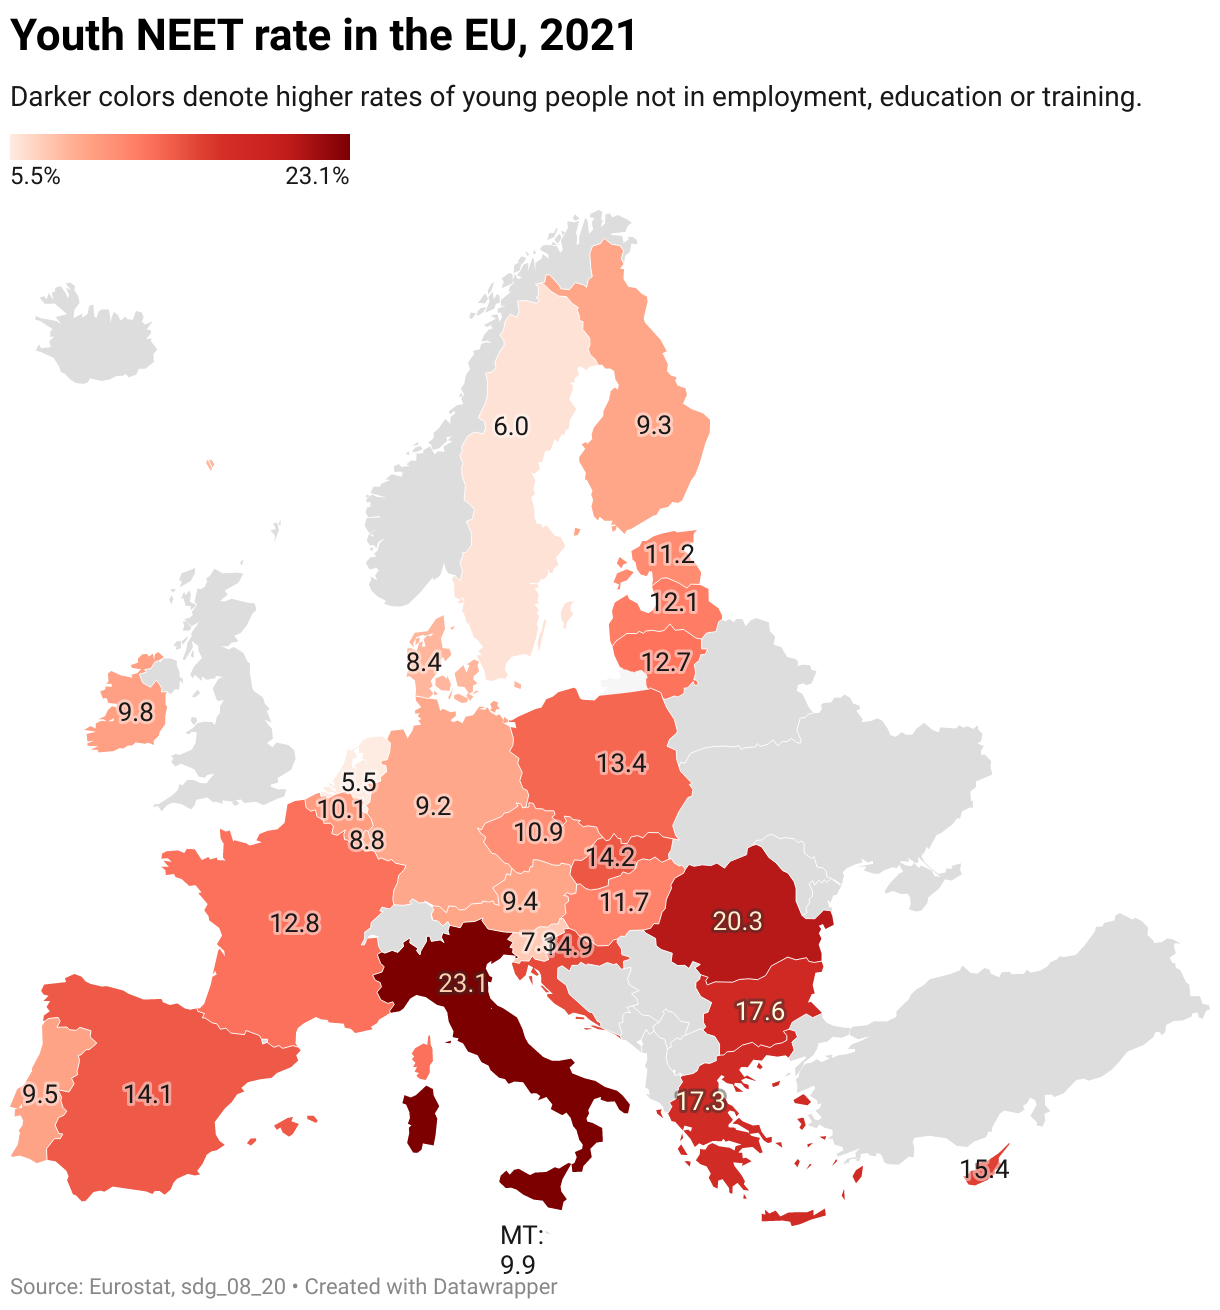
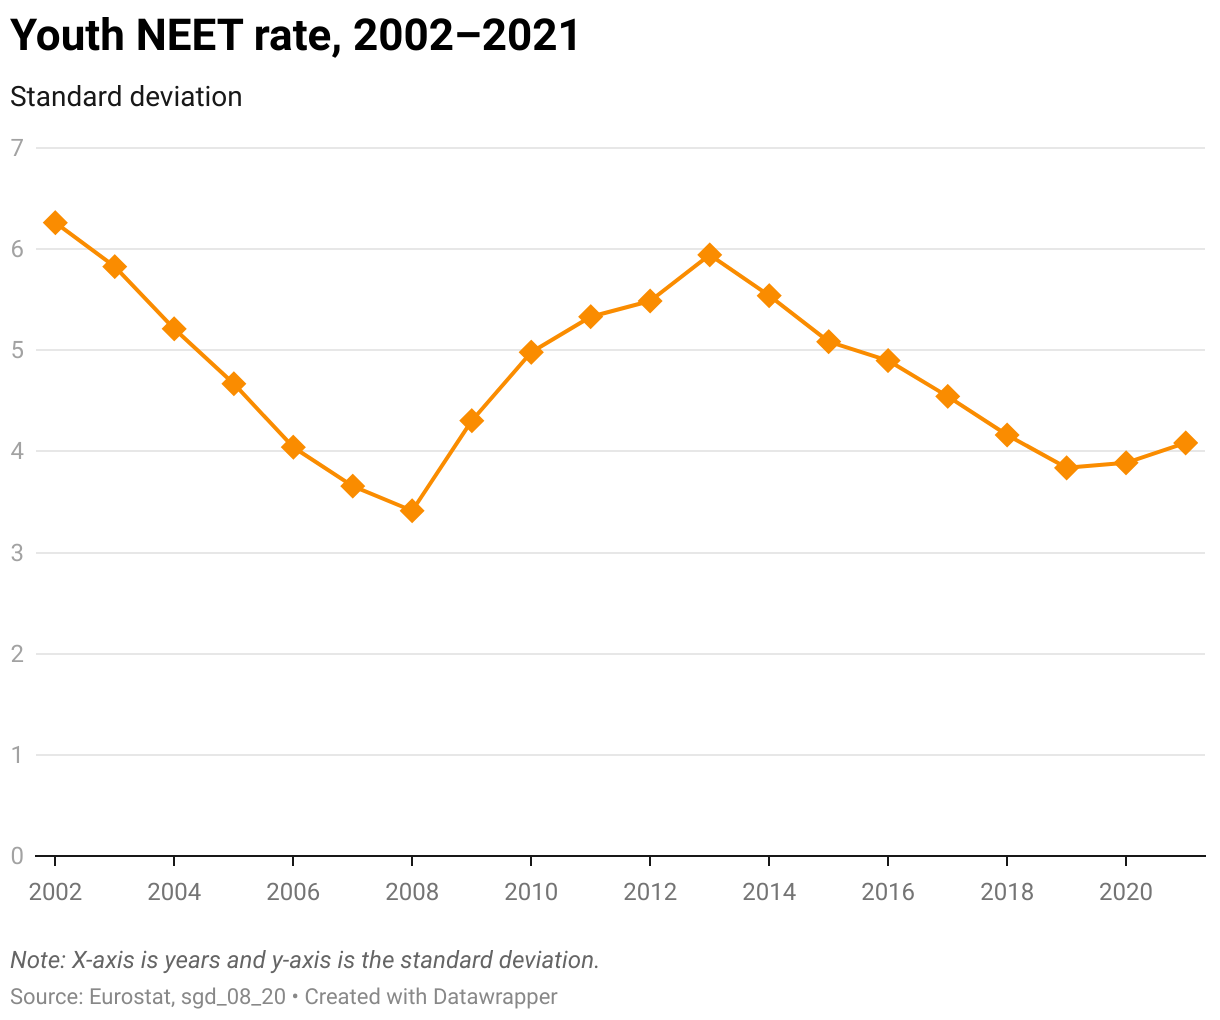
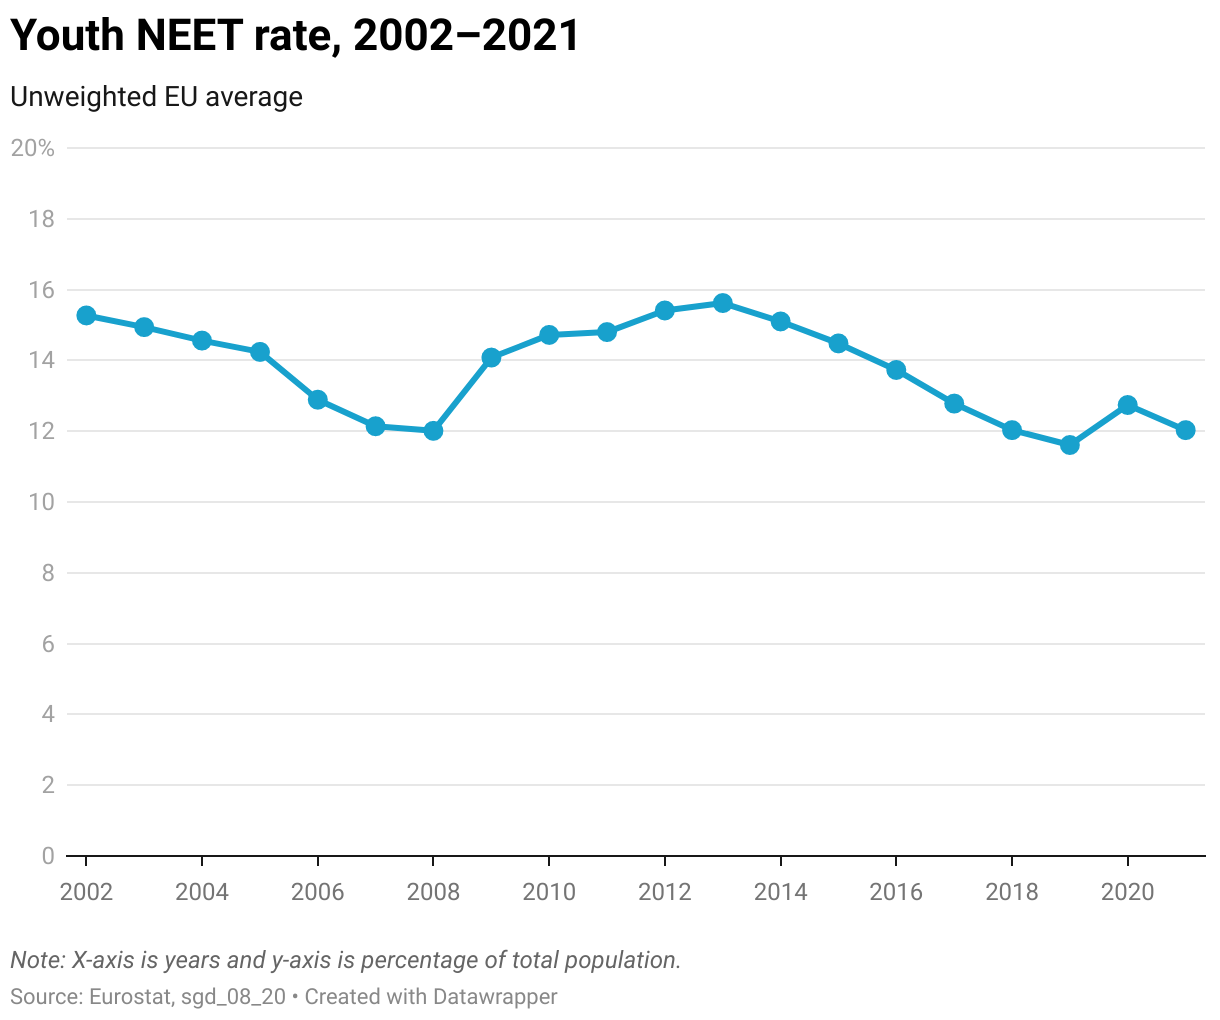
Youth NEET rate, 2002–2021
The rate of young people not in employment, education or training (NEETs) was strongly affected by the financial crisis (2008–2013). The pre-crisis progress of upward convergence was reversed during the crisis period, with disparities increasing and performance worsening. Post-crisis, there has been a return to upward convergence. While COVID-19 threatened to undo this progress, the encouraging trend of improving performance has continued in most Member States – but there remains a possibility that worst-performing countries will fall behind their peers, causing divergence (upward divergence).
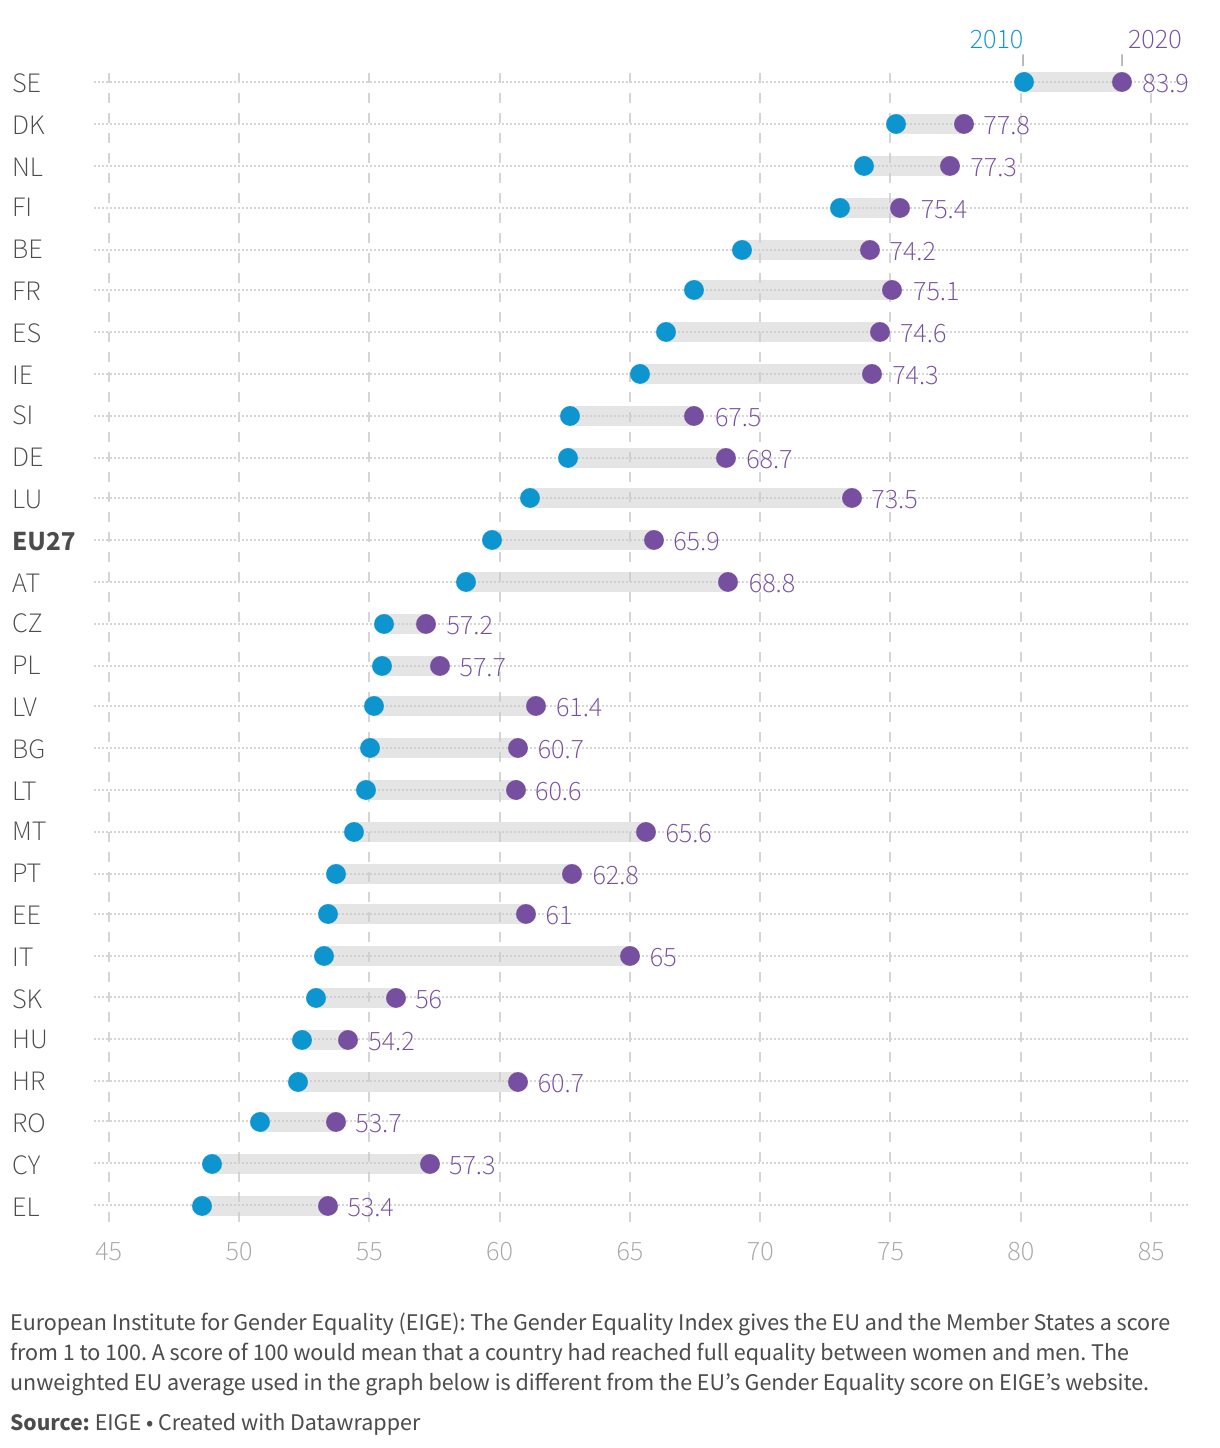
Gender Equality Index, 2010–2020
The Gender Equality Index gives the EU and the Member States a score from 1 to 100 and is computed by EIGE, the European Institute for Gender Equality. A score of 100 would mean that a country had reached full equality between women and men.
There has been upward convergence in gender equality in the EU27 since 2010. Disparities between Member States have dropped, and countries lagging behind have been catching up to leaders. The overall unweighted EU average index score has increased to 65.9 (out of 100) in 2020.
Note that the unweighted EU average used in the graph below is different from the EU’s Gender Equality score on EIGE’s website.
Gender Equality Index (EIGE), 2010 and 2020
The chart below compares scores for EIGE's Gender Equality Index in 2010 and 2020. Member States are ordered by their 2020 scores (a higher score denotes greater gender equality).