
Respondents with disabilities hit harder by unmet medical needs
Publicēts: 4 February 2025
Principle 3 of the European Pillar of Social Rights states: ‘Regardless of gender, racial or ethnic origin, religion or belief, disability, age or sexual orientation, everyone has the right to equal treatment and opportunities regarding employment, social protection, education, and access to goods and services available to the public. Equal opportunities of under-represented groups shall be fostered.’ However, people with disabilities [1] in Europe continue to face challenges in accessing healthcare.
Respondents with disabilities far more likely to report unmet medical needs
The latest edition of Eurofound’s e-survey, fielded in spring 2024, provides data on the unmet medical needs of people with disabilities. This non-probabilistic survey, initiated in 2020, offers insights into the factors contributing to these unmet needs. Since 2021, the survey has included a question that makes it possible to compare the situation of people with disabilities and those without disabilities.
The 2024 e-survey shows that 40% of respondents with disabilities report unmet medical needs; this compares with 17% of those without disabilities, a gap of 23 percentage points. [2] In 2021, the gap was smaller (16 percentage points), with 32% of respondents with disabilities and 16% of those without disabilities reporting unmet medical needs. Recent studies have shown that having a disability is the largest explanatory factor for unmet medical needs.
When comparing the different factors that could influence the likelihood of having unmet medical needs in 2024, the respondents’ household financial situation has the greatest impact. Among people with disabilities, 56% of those living in households that struggle to make ends meet report unmet medical needs, compared with only 28% of those without a disability (Figure 1). At the same time, 29% of respondents with disabilities living in households without financial difficulties report unmet medical needs, compared with 13% of respondents without disabilities who can make ends meet. This disparity is multiplied by a factor of roughly two for people with disabilities.
Among the sample of respondents with disabilities, 34% who completed tertiary education have unmet healthcare needs; this is 7 percentage points lower than those without a tertiary education. People with a higher education level tend to have access to higher-paying positions. In the case of respondents who do not have a disability, education level does not seem to be a significant factor: 16% of those with a tertiary education and 17% of those who have completed lower levels of education report unmet healthcare needs.
Among the respondents with disabilities, those aged 65 and over are more likely to have their medical needs met: only 30% of them report having unmet medical needs compared with 44% in the 35–64 age bracket. There is a higher prevalence of disability among people in this age group, as disability tends to become more common with age. A similar pattern is observed among people without a disability, who have lower levels of unmet medical needs (12% among those aged 65 and older). Gender is also a key determinant, as 42% of women have unmet medical needs, 6 percentage points more than men.
Finally, the proportion of unmet medical needs among respondents with disabilities also depends on their working status: 42% of non-working respondents report having unmet medical needs compared with 36% of those in work.
Figure 1: Unmet medical needs by sociodemographic characteristics and disability status, 2024 (%)
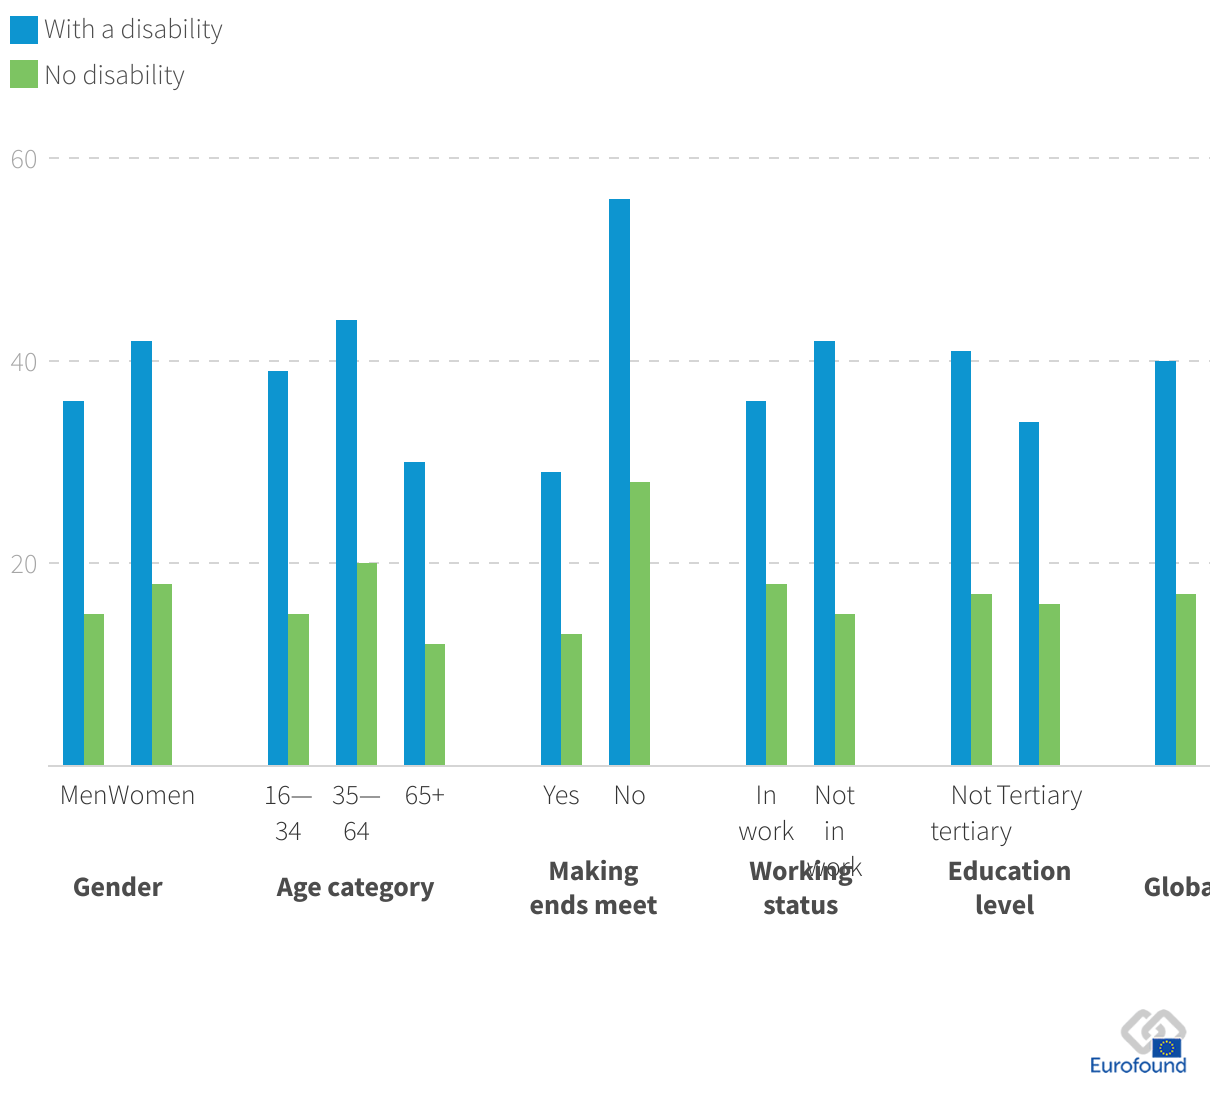
Source: 2024 e-survey
The e-survey also provides insights into the reasons for unmet medical needs. Compared with 2021, some reasons are now less relevant, in part because the COVID-19 pandemic is now behind us. For example, in 2024, fewer respondents mentioned that their appointment was not available or that they did not want to contract a virus.
The 2024 survey reveals clear similarities between respondents with and without disabilities. Both report similar percentages for being on a waiting list (around 70%), not having the treatment available (around 60%), or being unable to take time off (around 25%) (Figure 2). However, people with disabilities show some distinct patterns. For example, they report a higher percentage of not being able to afford the treatment (56% compared to 44%) or having to travel too far or lacking means of transport (27% versus 18%). These prevalences could be explained by the fact that not all public transport means are accessible for people with disabilities, but also because as mentioned previously, people with disabilities tend to live more often in households that struggle to make ends meet.
As previous analyses have shown, having a higher income reduces the likelihood of reporting unmet health needs due to affordability. However, this trend applies mostly to the general population. Among the respondents with disabilities, even those with higher incomes report being unable to afford healthcare at disproportionately higher rates compared with the rest of the e-survey sample with lower incomes.
Figure 2: Reasons for unmet medical needs, 2024 (%)
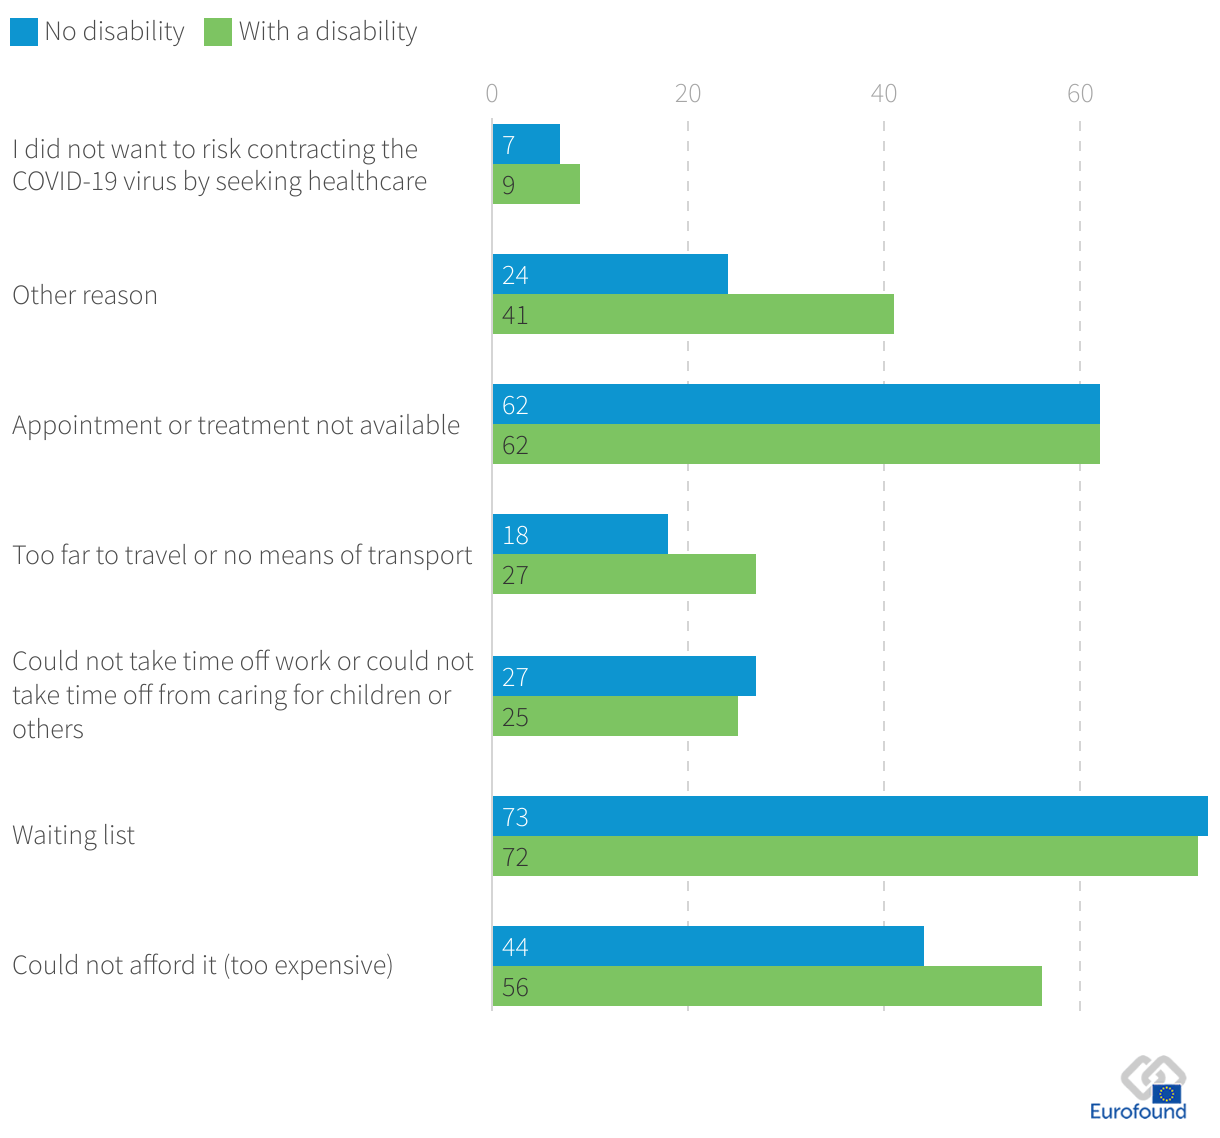
Source: 2024 e-survey
Rural versus urban – unmet needs but reasons may differ
Another interesting finding highlighted by the e-survey data is that the reasons for unmet healthcare needs vary depending on the type of area respondents with disabilities live in. The survey shows that those living in rural areas are more likely to report issues related to transport or the distance required to reach healthcare services (33%, compared with 22% of those living in urban areas) (Figure 3). These respondents are also more likely to state that the treatment they need is simply unavailable (64%, compared to 59%). On the other hand, in urban areas, respondents with disabilities are slightly more likely to report unmet medical needs due to other reasons not described above. The remaining reasons, such as long waiting lists and the unaffordability of medical healthcare, were mentioned in similar proportions for both urban and rural respondents with disabilities.
Figure 3: Reasons for the unmet medical needs of people with disabilities by type of area, 2024 (%)
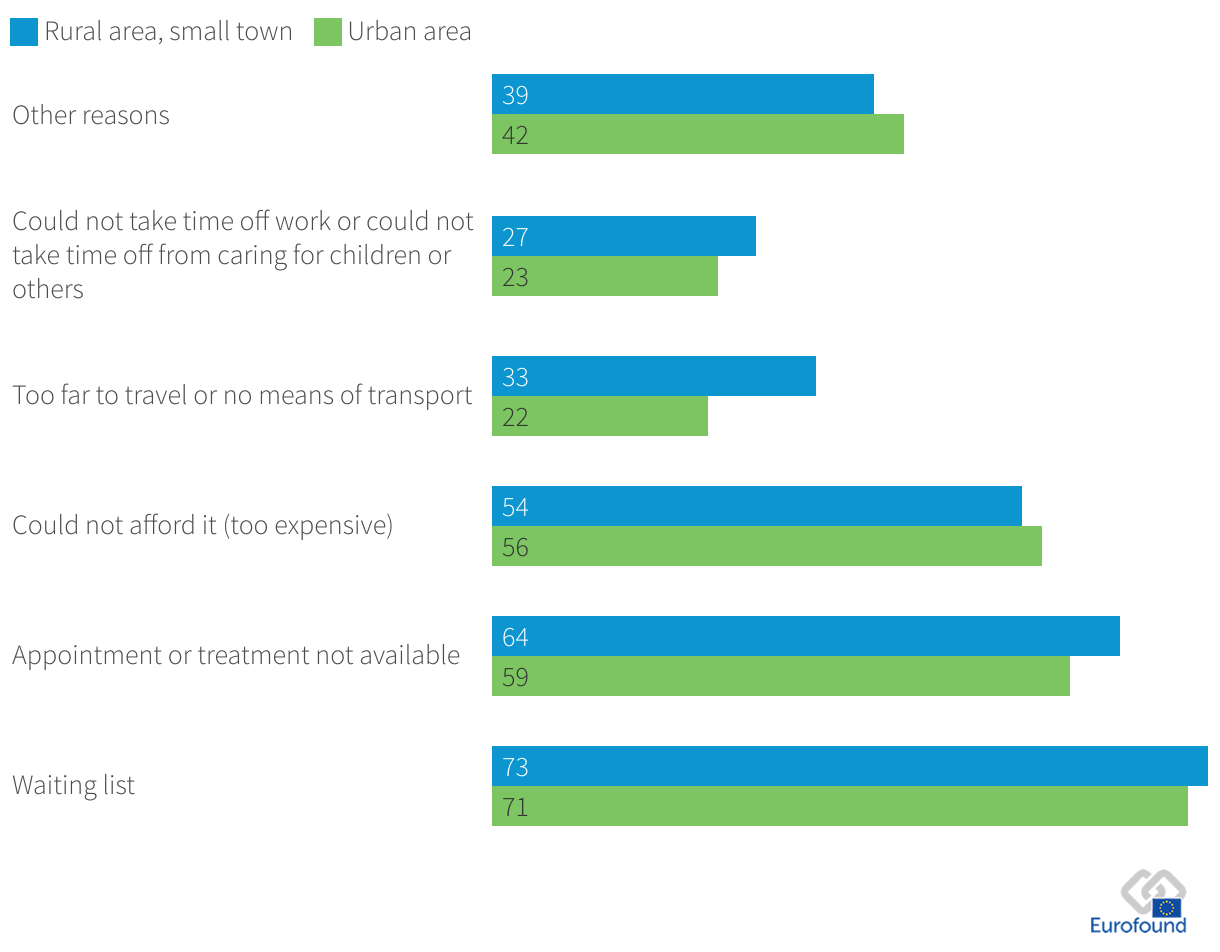
Source: 2024 e-survey
Financial situation, employment and age key determinants in unmet medical needs for respondents with disabilities
Conducting a logistic regression analysis helps to confirm some of the results previously described. In fact, among respondents with a disability, being 65 years or older, having a high income or being male are the characteristics that are most likely to reduce the probability of having unmet medical needs. All else being equal (age, gender, working status, education level, income category or living with a partner), being 65 years or older reduces the probability of having unmet medical needs by 18 percentage points compared with respondents aged 35–64 with the same characteristics (Figure 4). However, this result is not surprising, given that the older people get, the more likely they are to have a disability. A larger proportion of the population is therefore affected. Further analyses are needed to better understand this finding, but one possible explanation could be that this age group tends to have more free time to attend medical appointments, for example. Another possible explanation is that public policies on care and free access to transportation are often implemented for individuals aged 65 and older rather than for younger people. The regression analysis indicates that income is the most significant factor contributing to unmet medical needs among people with disabilities. Hence, having a high income also reduces the probability of having unmet medical needs by 7 percentage points compared with someone who has the same characteristics but is on a medium income. On the other hand, having a low income increases the probability of declaring unmet medical needs by 13 percentage points.
Being inactive also has an impact on a person’s probability of having their medical needs met, as it increases the probability by 7 percentage points compared with the reference population. At the same time, the model does not indicate a significant correlation between being unemployed and having unmet medical needs among people with disabilities. Education and having a partner are not significant and thus cannot be correlated with having unmet medical needs.
Figure 4: Determinants of the probability of having unmet medical needs, average marginal effect, 2024
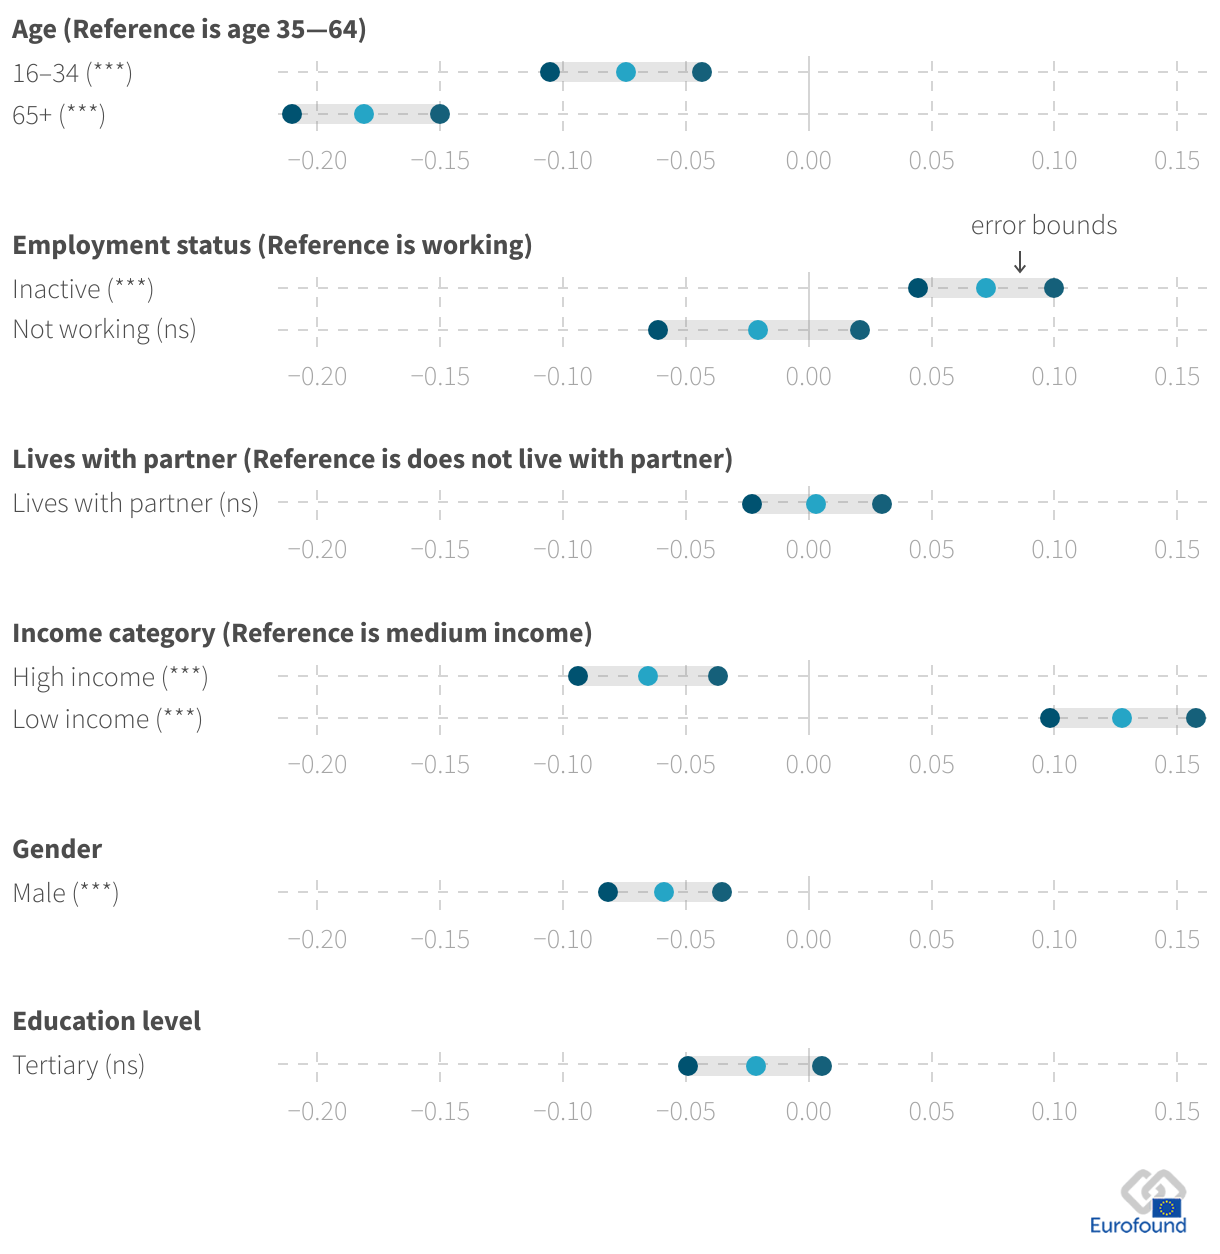
Notes: The chart illustrates the impact of various determinants on respondents’ unmet medical needs, with error bars representing the confidence intervals to indicate the precision of these estimates. Ref = reference category. Significance levels: ns = not significant; *** p < 0.001.
Source: 2024 e-survey; authors’ own calculations
Policy pointers
To ensure that people with disabilities can meet their healthcare needs, attention could be paid to the following policy pointers.
The survey shows that increased financial assistance is required to pay for healthcare needs. This calls for a better understanding of how healthcare costs for people with disabilities are covered and paid for. Financial assistance or compensation for travel expenses related to medical appointments is another measure that could be considered.
Offering workers with disabilities more flexible hours would ensure that they had time to prevent time-related barriers to healthcare.
Particular attention should be paid to people with disabilities living in rural areas. For this group of citizens, accessing healthcare services is often cumbersome. Improving e-healthcare services could improve access. Improved transport services could also help to alleviate the barriers.
Image © DC Studio/Adobe Stock
Footnotes
- 1) In 2023, more than a quarter (26.8%) of people aged 16 years and over in the EU had a disability.
- 2) The data are based on responses to the survey question: ‘During the last 12 months, have you needed a medical examination or treatment that you have not received?’.
Eurofound iesaka šo publikāciju citēt šādi.
Eurofound (2025), Respondents with disabilities hit harder by unmet medical needs, article.
