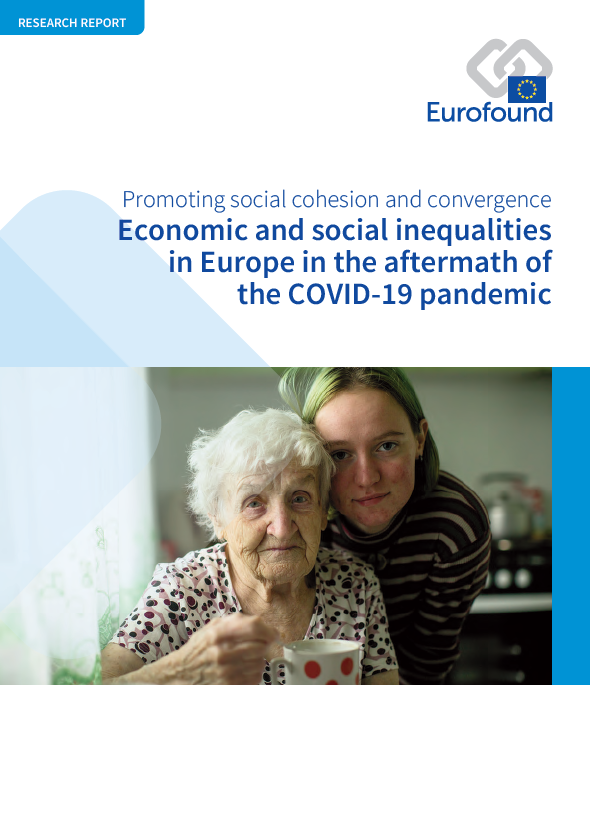
A Covid19-világjárvány a meglévő hátrányoktól függően eltérő hatást gyakorolt a társadalmi csoportokra, és széles körben úgy vélték, hogy az élet különböző területein az egyenlőtlenségek növekedését idézte elő. Ez a jelentés az EU többdimenziós egyenlőtlenségeket nyomon követő keretrendszerének (MIMF) mutatóit felhasználva mutatja be, hogyan változott az egyenlőtlenség a jövedelem, az egészségügy, a foglalkoztatás és az oktatás területén 2010 és 2020 között. Megvizsgálja továbbá e változás fő mozgatórugóit a világjárvány idején, és feltárja a kormányzati politikák és az egyenlőtlenség közötti kapcsolatokat több területen.
Key findings
A Covid19-válság első évében folytatódott a jövedelmi egyenlőtlenségek csökkenése, ami egyúttal az egyenlőtlenség szintjének csökkenését is eredményezte az EU-ban. A munkakeresők és az alacsony és közepes iskolai végzettséggel rendelkezők körében azonban leginkább a jövedelem visszaesése volt tapasztalható a világjárvány idején, ami rávilágít arra, hogy bár a jövedelmi egyenlőtlenség összességében nem nőtt a Covid19 idején, a politikai döntéshozók számára döntő fontosságú, hogy ezt szorosan figyelemmel kísérjék a jelenlegi megélhetési költségek terén jelentkező válság során.
Az egészségügy és a jövedelmi egyenlőtlenségek szorosan összefüggnek, és a legalacsonyabb jövedelmi kvintilisbe tartozók közel háromszor akkora valószínűséggel élnek fogyatékossággal, mint a legmagasabb 20%. A világjárvány során az egészségügyi szolgáltatásokhoz való hozzáférés jövedelem szerinti egyenlőtlensége is nőtt: 2020-ban a legalacsonyabb jövedelmi kvintilisbe tartozók kielégítetlen egészségügyi szükségletének kockázata 5,4-szer magasabb volt, mint a felső 20%-ban, ami rávilágított arra, hogy a jövedelmi egyenlőtlenségek csökkentésére összpontosító szakpolitikák hogyan csökkenthetik az egészség terén mutatkozó egyenlőtlenségeket.
A megállapítások szerint a világjárvány idején az otthonról történő munkavégzés egyenlőtlenségeket teremthetett az alacsony és magas jövedelmű csoportok között, ahol az ideiglenes munkavállalók, a fiatalok és a bizonytalan foglalkoztatási helyzetben lévők kiszolgáltatottabbá váltak a válságokkal szemben. Annak biztosítása érdekében, hogy ez ne folytatódjon a Covid19 utáni munka egyre rugalmasabbá alakuló világában, döntő fontosságú lesz a politikai döntéshozók számára a foglalkoztatási bizonytalanságok kezelése, valamint a munkakörülmények átláthatóságának és kiszámíthatóságának növelése.
A világjárvány idején a jövedelemnél fontosabb volt, hogy megfelelő eszközök álljanak rendelkezésre az online tanuláshoz, ami rávilágított a digitális szakadék kezelésének és a technológiához való hosszú távú hozzáférésnek a fontosságára. A vidéki környezetben élő szülők és diákok, akiknek ebben az időszakban nem kellett ingázniuk, nagyobb valószínűséggel elégedettek az online oktatás vagy oktatás minőségével, mint a városokban élők.
Az otthonról történő munkavégzés képessége egyenlőtlenségeket teremtett az alacsony és magas jövedelmű csoportok között, fokozva a nemek közötti egyenlőtlenséget a gyermekgondozásban és a házimunkában. 2020-ban az egyedülálló anyák nagy valószínűséggel csökkentették munkaidejüket az iskolák és a gyermekgondozási létesítmények bezárása miatt – ha a nők továbbra is több órányi fizetés nélküli gondozást végeznek, mint a férfiak, ez potenciálisan növelheti a nemek közötti bérszakadékot a helyreállítás során.
The report contains the following lists of tables and figures.
List of tables
Table 1: Indicators selected for the income inequality analysis
Table 2: OLS regression model exploring the relationship between government spending and inequality in making ends meet according to education level
Table 3: Panel OLS regression exploring general drivers of income inequality (1995–2020), EU27
Table 4: OLS regression model exploring drivers of income inequality between rural and urban households
Table 5: OLS regression model exploring income inequality by individual characteristics
Table 6: Logistic regressions on income inequality by individual characteristics
Table 7: Indicators selected for the health inequality analysis
Table 8: OLS regression model exploring the relationship between government expenditure and inequality in chronic disease
Table 9: Multilevel logit regression model on worsening health between 2019 and 2020
Table 10: Multilevel logit regression models on worsening health and mental health between 2019 and 2020
Table 11: Indicators selected for the employment inequality analysis
Table 12: OLS regression model exploring the relationship between government expenditure and inequality in opportunity in having a white-collar job
Table 13: OLS regression model exploring the relationship between gender inequality in occupations, childcare and paid leave at country level
Table 14: OLS regression model exploring the relationship between gender inequality in being employed, childcare and paid leave at country level
Table 15: Random effects within–between model showing the relationship between gender inequality in employment, over time and between countries
Table 16: Multilevel linear regression model on the number of hours worked in 2019 and 2020
Table 17: Multilevel linear regression model on the change in the number of hours worked between 2018 and 2019 and between 2019 and 2020
Table 18: Indicators selected for inequality in education analysis
Table 19: OLS regression model exploring the relationship between government spending and inequality in PISA scores
Table 20: Determinants of respondents’ satisfaction with the quality of their children’s online schooling (multilevel ordered logit model)
List of figures
Figure 1: Dimensions of life of the EU MIMF
Figure 2: Intersectional approach to effects of COVID-19 on inequality
Figure 3: Macro-, meso- and micro-level factors in income inequality during the COVID-19 pandemic
Figure 4: Heatmap showing the results of income inequality indicators by country, 2018–2019, EU27 and the UK
Figure 5: Income quintile share ratio (S80/S20) for equivalised disposable income, EU27
Figure 6: Gini coefficient of equivalised disposable income, EU27, Bulgaria, Greece and Poland
Figure 7: Odds ratio of a household having problems making ends meet (with versus without a tertiary education, 2018) against spending on education (2015, % of GDP), EU27 and the UK
Figure 8: Odds ratio of a household having problems making ends meet (with versus without a tertiary education, 2018) against spending on social protection (2015, % of GDP), EU27 and the UK
Figure 9: Scatterplot of government spending on social protection (% of GDP at time t–1) relative to the Gini index of disposable income at time t (1995–2020), EU27
Figure 10: Odds ratio of households having problems making ends meet (rural versus urban, 2018) against public investments in agricultural R&D (2015, % of GDP), EU27 and the UK
Figure 11: Households that reported that their income decreased in 2020 compared with the previous year by country (%), selected Member States
Figure 12: Households containing people aged 50+ that received financial support from the government due to the pandemic by country (%), selected European countries
Figure 13: Recipients of pandemic-related government support by country, EU27 (%)
Figure 14: Macro-, meso- and micro-level factors in health inequality during the COVID-19 pandemic
Figure 15: Heatmap presenting the results of health inequality indicators, 2018–2019, EU27 and the UK
Figure 16: Map of odds ratios of people reporting unmet medical care needs (women versus men, adjusted), 2018
Figure 17: Heatmap of odds ratio of feeling depressed for different social groups, 2018–2019, EU27 and the UK
Figure 18: Risk ratios of having a severe long-standing limitation in usual activities (disability) due to a health problem for various social groups (2010–2020), EU27
Figure 19: Risk ratios of having an unmet medical need due to high cost, distance to travel or waiting lists for various social groups (2010–2020), EU27
Figure 20: Government spending on education in 2002 (% of GDP) relative to ex ante inequality of opportunity in having two or more chronic diseases in 2019 (aged 50+), EU27
Figure 21: Macro-, meso- and micro-level factors in inequality in working life outcomes during the COVID-19 pandemic
Figure 22: Heatmap showing results of working life inequality indicators, 2018–2019, EU27 and the UK
Figure 23: Risk ratios of gender inequality in various dimensions of working life (2002–2020), EU27
Figure 24: Risk ratios of unemployment rates among various social groups (2002–2020), EU27
Figure 25: Risk ratios of employment rates among various social groups (2002–2020), EU27
Figure 26: Odds ratio of women being in employment versus men (2019) against the share of children under three years of age in formal childcare (2019, %), EU27
Figure 27: Average number of weekly hours worked in 2020 by country and contract type, selected EU Member States
Figure 28: Proportion of women who held second or third jobs by household type, 2020 (%)
Figure 29: Macro-, meso- and micro-level factors in inequality in education and learning during the COVID-19 pandemic
Figure 30: Heatmap showing results of education inequality indicators, 2018–2019, EU27 and the UK
Figure 31: Difference in tertiary education attainment as a whole in 55- to 74-year-olds and those with parents with a lower than tertiary education (2021)
Figure 32: Trends regarding inequality in education between women and men (2002–2020), EU27
Figure 33: Risk and odds ratios of NEET rates between various social groups (2004–2020), EU27
Figure 34: Government spending on education (2013, % of GDP) against P90/P10 PISA scores in mathematics (2018), EU27 and the UK
Figure 35: Parents’ satisfaction with the quality of online schooling for their children, EU27 (%)
Figure 36: Parents’ satisfaction with the quality of their children’s online schooling depending on whether they worked from home or not during the pandemic, EU27 (%)
- Number of pages
-
102
- Reference nº
-
EF22002
- ISBN
-
978-92-897-2309-1
- Catalogue nº
-
TJ-07-23-019-EN-N
- DOI
-
10.2806/439913
- Permalink
Cite this publication
Eurofound (2023), Economic and social inequalities in Europe in the aftermath of the COVID-19 pandemic, Publications Office of the European Union, Luxembourg.
